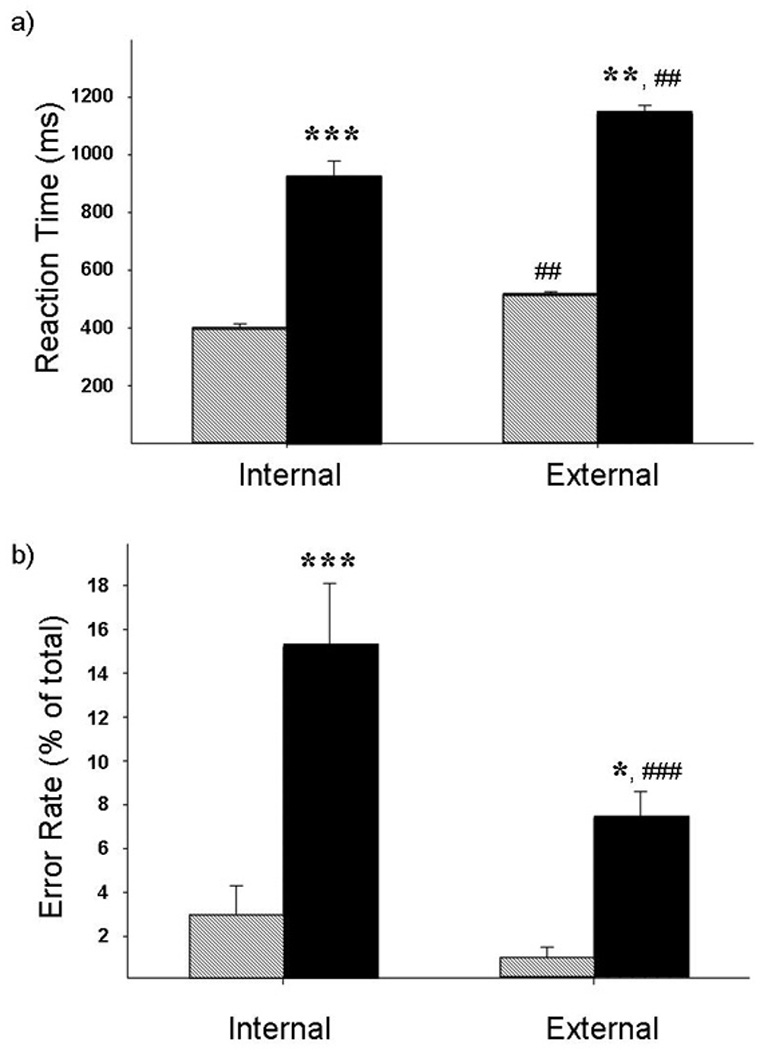
Figure 1. Task Performance.

Mean (with standard error) reaction time (a) and error rate (b) for the non-drug using control group (dashed) and the cocaine users (solid). The cocaine users had significantly longer reaction times and higher error rates for both the internally-guided and externally-guided tasks. * p<0.01, ** p<0.001, ***p<0.0001
