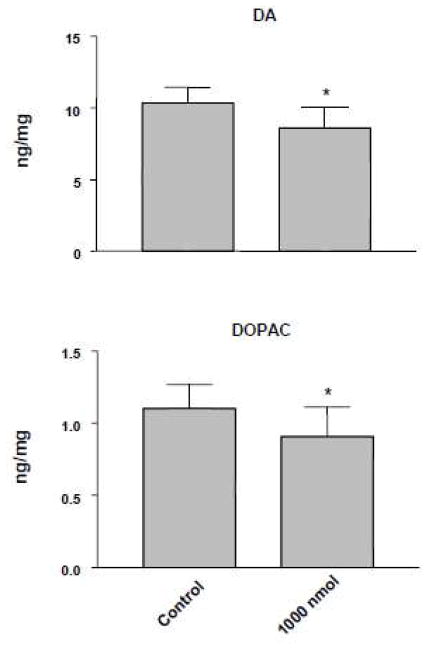
Figure 3.
DA (upper panel) and DOPAC (lower panel) levels in striatum of rats one week after intracerebroventricular administration of THMA (1000 nmol). Control animals received unilateral intracerebroventricular injections of an equivalent volume of aCSF. Values represent the mean ±SD. A one-way ANOVA followed by Tukey’s multiple comparison test was performed and differences regarded as significant when p<0.05. * Indicates significant different from control group.

