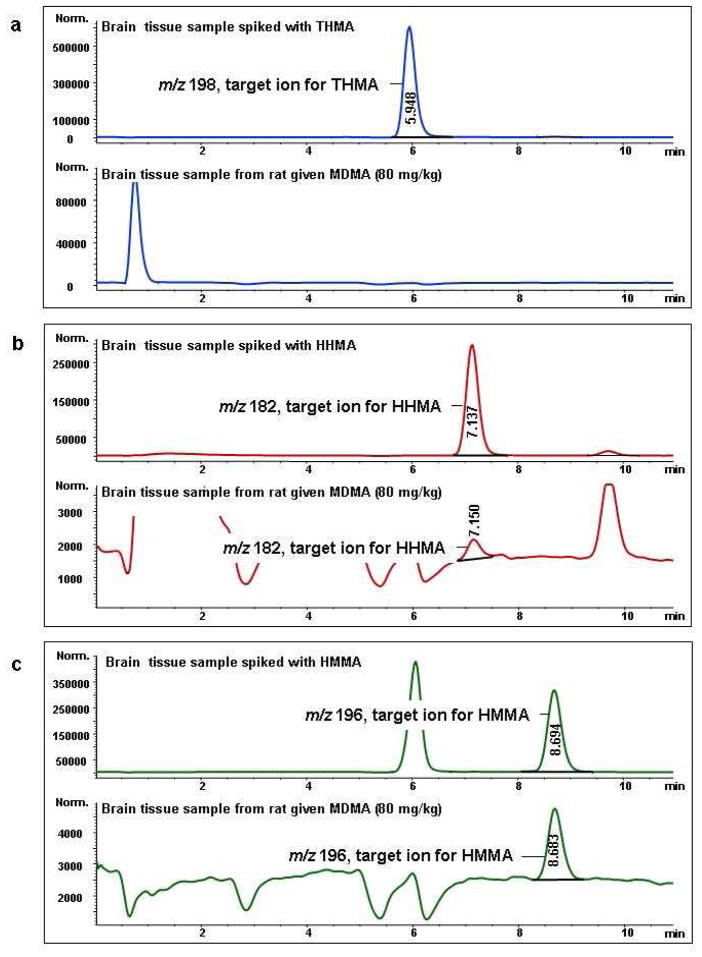
Figure 5.
Mass chromatograms of the target ions of THMA (a), HHMA (b), and HMMA (c). Top chromatograms of each part (a–c) show given ions in rat brain tissue spiked with THMA, HHMA, and HMMA, respectively. Final tissue concentration of each spiked analyte was 5 μg/g. Bottom chromatograms of each part (a–c) show given ions in an authentic brain tissue samples taken from rats (N=3) treated with a high neurotoxic dose of MDMA (80 mg/kg; SC) three hours previously. Similar results were obtained in rats treated identically but sacrificed 1.5 (instead of 3) hr after drug administration.

