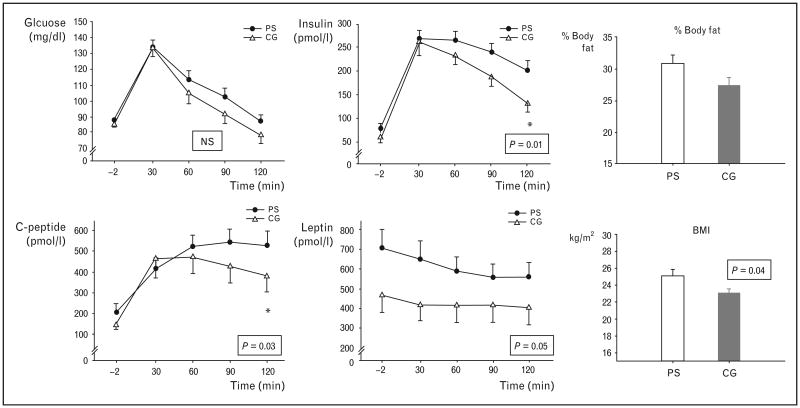
Figure 2. Mean glucose, insulin, C-peptide, and leptin responses (±SEM) to an oral glucose tolerance test in prenatally stressed (PS, ‘black circles’) and comparison group (CG, ‘white triangles’) individuals (left panel).
Glucose levels were not significantly different across the groups, however, PS individuals showed significantly elevated 2 h insulin (P=0.01) and C-peptide levels (P=0.03), as well as higher leptin levels at all time points during the oral glucose tolerance test (OGTT) (P=0.05). In addition, PS individuals had a higher % body fat and a higher BMI (P=0.04, right panel). Adapted with permission from [23].

