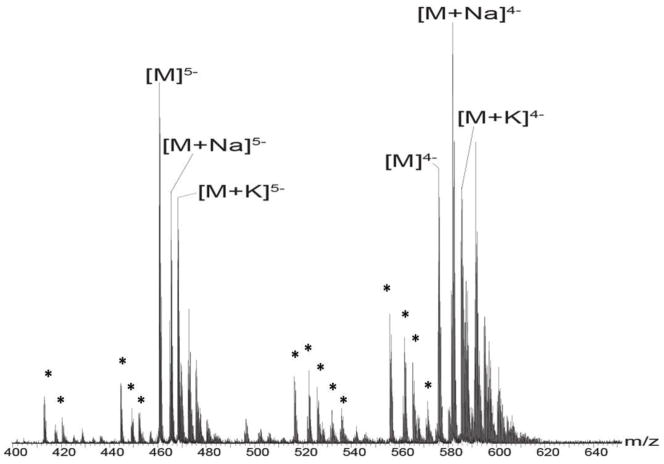
Figure 1.
Negative ion mode mass spectrum of 10μM dodecasulfated heparin octasaccharide dissolved in menthol/water/acetic acid solution (49/49/2; v/v/v). M represents dodecasulfated heparin octasaccharide. The charge distributions of 4- and 5- ions of heparin octasaccharides are illustrated. Asterisks represent desulfated ions corresponding to 5- or 4- charge state species. Mass to charge ratios of the heparin octasaccharides are shown in Table 1 of supplementary material.

