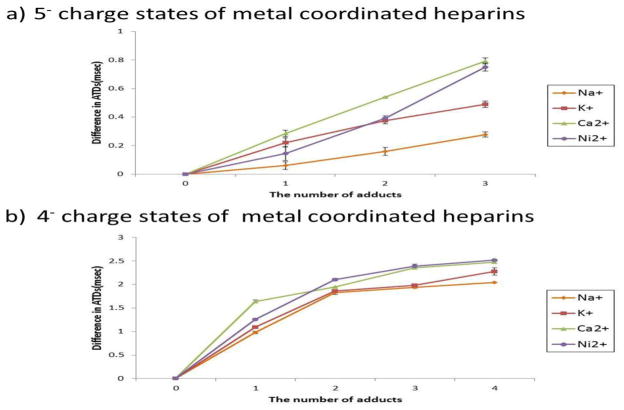
Figure 3.
The difference in arrival time distributions between metal and metal free coordinated heparin octasaccharide, plotted against the number of metal adducts a) in the 5- charge state b) in the 4- charge state. Differences in ATDs are calculated by subtracting the ATDs for metal coordinated octasaccharides from those of the metal free species. ATDs of calcium and potassium coordinated octasaccharide that exhibit two ion populations in the ion mobility spectrum are shown with the most abundant ion population represented.

