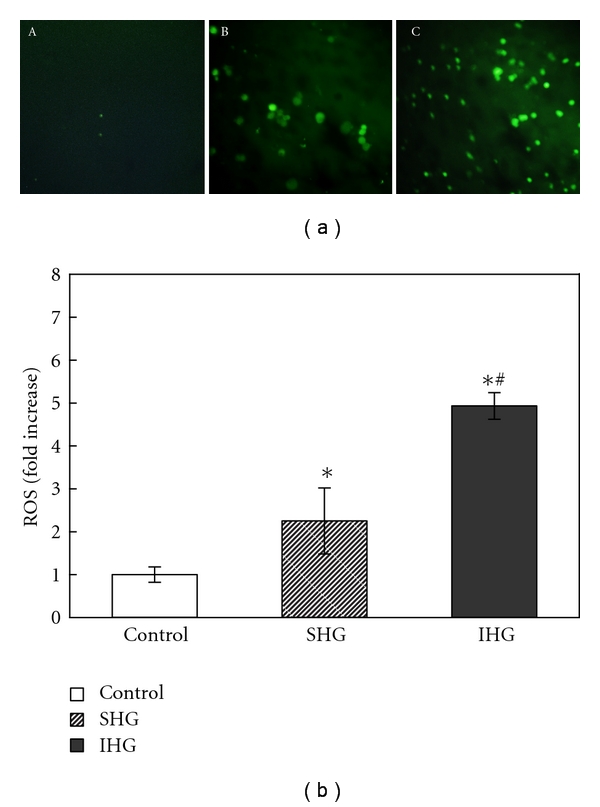
Figure 4.

Demonstration of intracellular ROS of INS-1 cells with DCFH-DA staining. (a). Images of DCFH-DA staining for INS-1 cells with different treatment. The graph (A) control group, (B) INS-1 cells exposed to stable high glucose, and (C) INS-1 cells exposed to intermittent high glucose. (b). Data of DCFH-DA fluorescence intensity analysis, *P < .05 versus control, ∗# P < .05 versus SHG.
