
Figure 1.
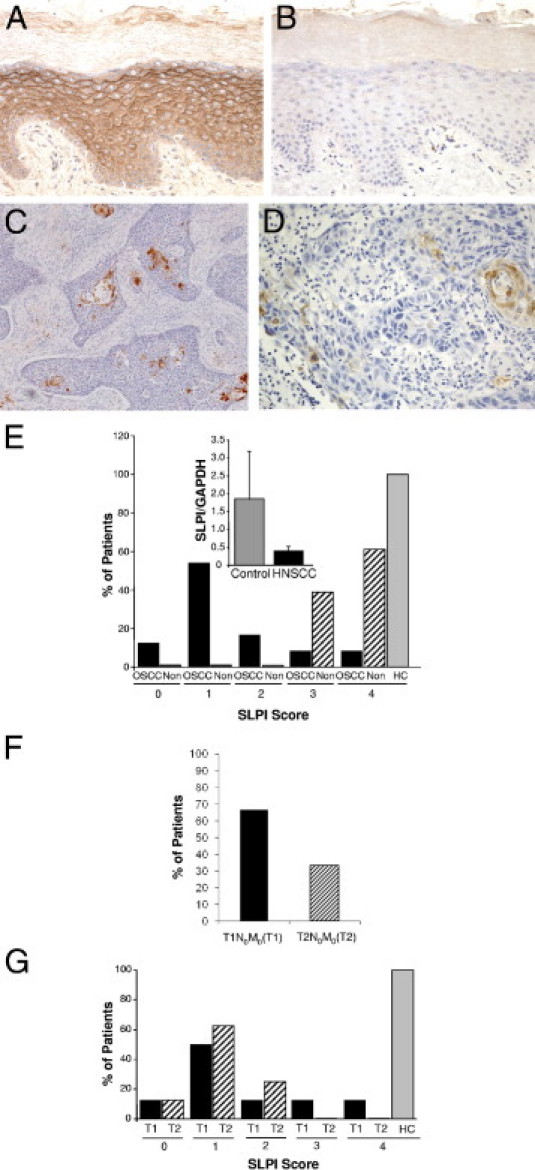
SLPI expression in OSCC. A–D: IHC staining for SLPI in representative tissue sections from control oral epithelium (A) with isotype control (B) at original magnification, ×20. C: SLPI staining of OSCC (×10) and (×20) (D) with limited SLPI-positive cells and without evidence of staining in inflammatory infiltrates. E: SLPI staining is categorized according to the percentage of positively stained cells, and the percentage of patients (OSCC) (n = 24), noninvolved (Non) surrounding tissues (n = 23), and healthy controls (HC) in each SLPI category are shown. P < 0.001 between SLPI staining in HC and OSCC by Fisher's exact test; OSCC versus noninvolved P < 0.001. Inset: RNA from healthy oral epithelium (control) and HNSCC tissue (n = 10) was probed for SLPI and GAPDH expression by RT-PCR and the ratio of SLPI to GAPDH shown. Mean ± SEM. F: Tumor stage: Percentage of patients categorized as T1N0M0(T1) and T2N0M0(T2) stages. G: OSCC (%) patients in T1N0M0(T1) and T2N0M0(T2) stages with SLPI expression levels (scores, 0 to 4). A comparison of SLPI expression in tumor stages to healthy control (HC) by Fisher's exact test showed a significant inverse correlation between SLPI and T1N0M0 (P = 0.003) and T2N0M0 (P = 0.002).