
Figure 5.
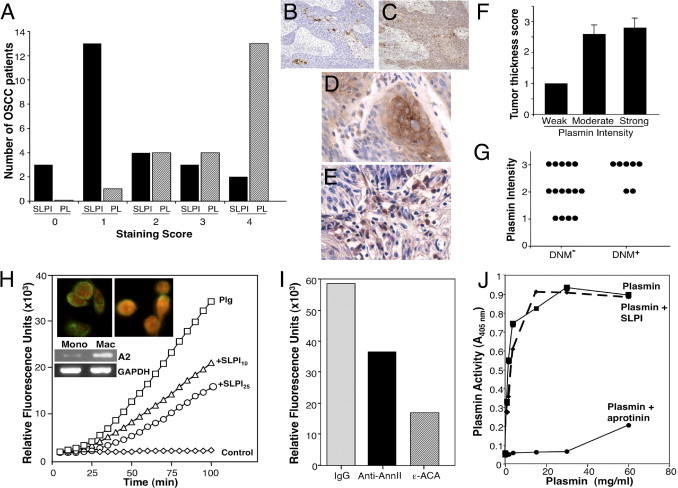
Plasmin expression in OSCC and SLPI regulation of macrophage plasminogen activation. A: Plasmin staining was classified according to percentage positively staining cells (0 to 4). Number of patients in each plasmin category is shown in parallel with SLPI staining. B and C: IHC staining for SLPI (B) and plasmin (C) in tumor sections. Original magnification, ×10. D and E: IHC staining for plasmin in tumor (D) and in inflammatory cell infiltrate (E) in OSCC tissue sections. Original magnification, ×40. F: Plasmin staining was semiquantitatively classified according to intensity of staining: W (weak = 1), M (moderate = 2), and S (strong = 3) and mean grade for tumor thickness (TT) related to these staining categories. TT r = 0.511, P < 0.03. G: Relationship between plasmin stain intensity and DNM (n = 7). By point biserial correlation, r = 0.402, P = 0.07, showing positive, but not significant correlation between intensity of plasmin stain and DNM. H: Monocytes (1 × 10⁶ cells/mL) in incubation buffer (100 μL of Hepes-buffered saline containing 3 mmol/L CaCl2 and 1 mmol/L MgCl2) were incubated with 100 nmol/L glu- plasminogen for 1 hour at 4°C. Then SLPI (10 to 25 μg/mL) was added for 45 minutes at 4°C, the cells washed, tPA (12 nmol/L) and the fluorogenic plasmin substrate AFC-081 (166 μmol/L) were added. Control represents cells with substrate and tPA, but no plasminogen. Substrate hydrolysis was measured at 5-minute intervals. Inset: For fluorescence microscopy, macrophages cultured in four-chamber glass slides were incubated with biotinylated rhSLPI (left)23 or without (right) for 5 minutes at 37°C, washed with PBS, and incubated with neutravidin-FITC (green) in PBS for 30 minutes at 4°C. Slides were rinsed, fixed in 2% paraformaldehyde, incubated with propidium iodide (red) for 5 minutes, rinsed, and mounted with SlowFade reagent before fluorescence microscopy. Inset: Parallel unstimulated monocyte and macrophage RNA from three donors was probed for annexin II and GAPDH by RT-PCR. I: Monocytes were incubated with plasminogen as described in A and then rabbit polyclonal anti-annexin II IgG, rabbit IgG (60 μg/mL) and ε-ACA at 10 mmol/L were added for 45 minutes before tPA and AFC-081 were added and hydrolysis measured (100 minutes shown) (n = 4). J: Plasmin was incubated with 50 μL of buffer, SLPI, or aprotinin (10 KIU/mL) for 15 minutes at 37°C before addition of Spectrozyme PL. Plasmin generation/activity was directly proportional to the increase in absorbance at 405 nm.