
Figure 7.
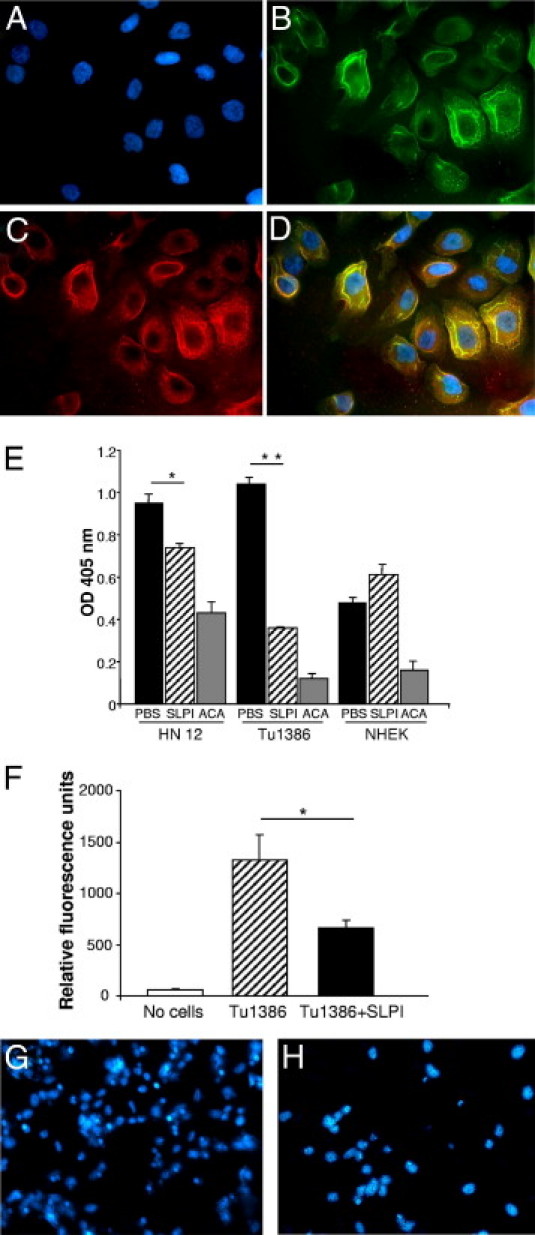
Annexin A2 in tumor cell lines and modulation of plasminogen activation and cell invasion by SLPI. A–D: HN12 cultured on coverslips in 24-well plates were stained for DAPI (blue nuclei) (A), annexin A2 (FITC secondary antibody) (B), and SLPI(TRITC secondary antibody) (C), and the images overlaid (D). Yellow indicates colocalization. E: HN12, Tu1386, and NHEK cells (2 × 10⁵) were cultured in 12-well plates with SLPI (5 μg/mL), ε-amino-caproic acid (ACA) (0.5 M), and PBS for 1 hour in phenol red–free medium, incubated with 0.5 μmol/L plasminogen for 4 hours at 37°C and the cellular plasmin generated from plasminogen monitored by measuring amidolytic activity. The reaction was initiated by adding colorimetric substrate H-d-norleucyl-hexahydrotyrosyl-lysine-p-nitroanilide to 200 μL of conditioned medium and monitored at 405 nm on a microplate reader. *P = 0.02; **P < 0.001. F: Tu1386 cells were incubated in the absence or presence of SLPI (5 μg/mL) in the invasive cell assay for 48 hours. Invasive cells were lysed and stained with CyQuant GR dye. Fluorescence was quantified using a 480-nm/530-nm filter set. *P = 0.003, Student's t-test. Results are representative of three experiments. G and H: After Tu1386 cells incubated in the absence (G) or presence (H) of SLPI (5 μg/mL) migrated in the invasive cell assay for 48 hours, the filters were fixed, incubated in DAPI, mounted, and photographed.