
Figure 6.
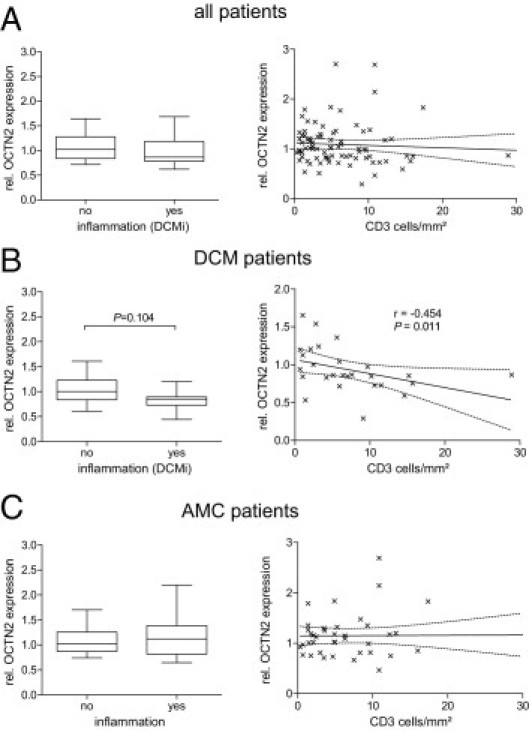
mRNA expression of OCTN2 in EMB specimens of cardiac patients with or without an immunohistologic proof of cardiac inflammation (left). Data depicted on the right show the correlation between OCTN2 expression and the cardiac CD3+ cell count (cells/mm2). Analysis was performed for all patients (n = 83, A), DCM patients (n = 27, B), and AMC patients (n = 39, C). Values are depicted in relation (rel.) to the median expression of all samples. For statistical testing, Mann-Whitney U-test and Spearman test were used.