
Figure 3.
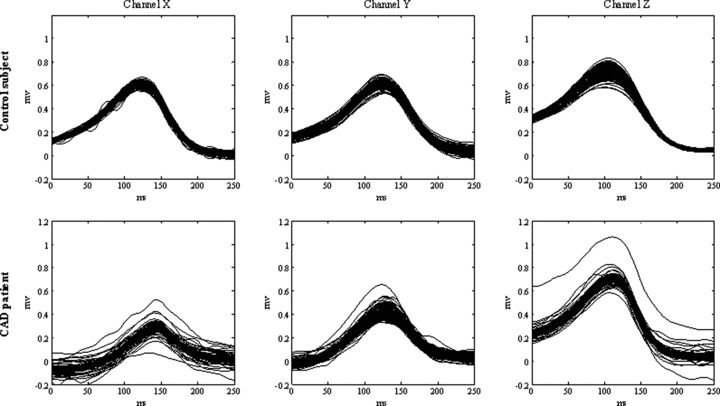
Superimposition of 128 consecutive T‐waves (X, Y, and Z leads) from ECG tracings of the control subject of Figure 2 (TWA duration = 41 beat; TWA amplitude = 68 μV, TWA product = 2955 beat·μV), and a CAD patient (TWA duration = 76 beat; TWA amplitude = 105 μV, and TWA product = 8151 beat·μV). Both cases fall in the TWA+ region.