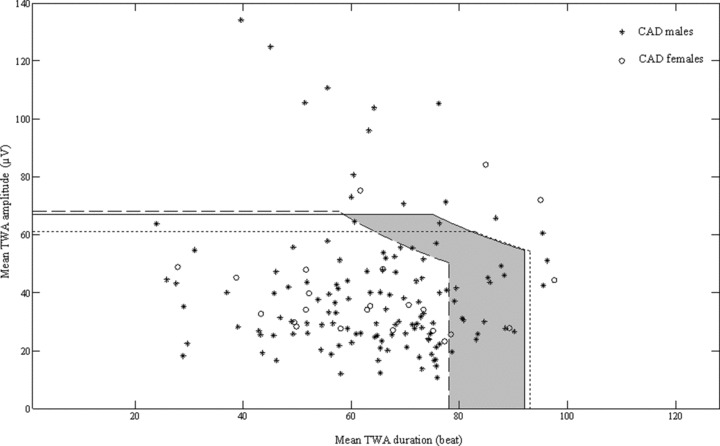
Figure 4.

Superimposition of the TWA normality regions, respectively, defined over the entire control population (solid line), the control‐male subgroup (dashed line) and the control‐female subgroup (dotted line). Compared to the control‐population normality region, the control‐male normality region is characterized by a significant reduction of TWA duration threshold which gives rise to the shaded zone where 17 extra CAD‐male patients are identified as TWA+ with a gender‐related analysis.
