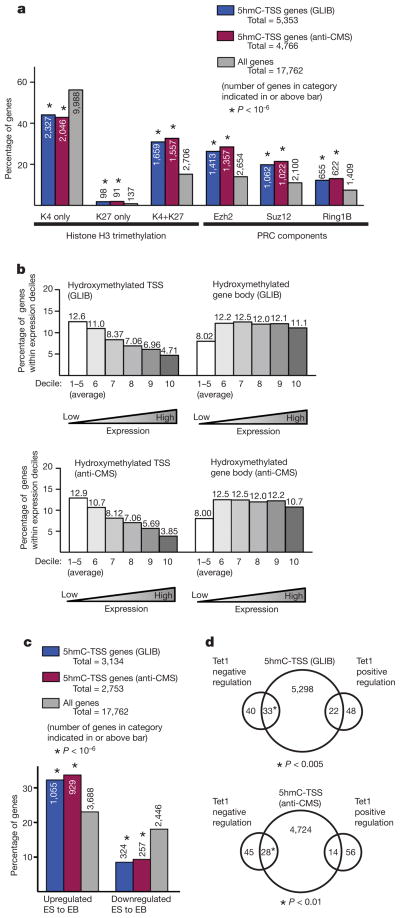
Figure 3. Properties of HERGs at transcription start sites.
a, The percentage of genes with 5hmC at the TSS (blue and red bars) reported to contain histone H3 trimethylation (left) or PRC components (right) at their promoters is compared to the fraction of all genes (grey bars) with these promoter marks22. Number of genes in each category is indicated. b, HERGs are enriched at the TSSs of genes with low expression in ES cells. All genes were ranked by level of expression in ES cells21 and sorted into deciles from lowest to highest. The per cent of genes within the decile category with 5-hmC enriched at the TSS (left) or within gene bodies (right) are shown for each methodology. The first five deciles, which are comprised of genes lacking statistically significant expression, are pooled and averaged in this analysis. c, HERGs are enriched at the TSS of genes upregulated upon differentiation to embryoid bodies (EB)26. The percentage of genes with 5-hmC at their TSS (blue bars) that are substantially upregulated or downregulated upon differentiation to EB is compared with the percentage of total genes similarly regulated (grey bars). Number of genes in each category is indicated. d, Overlap between genes with 5hmC at the TSS and genes positively or negatively regulated by Tet1 (ref. 8).

