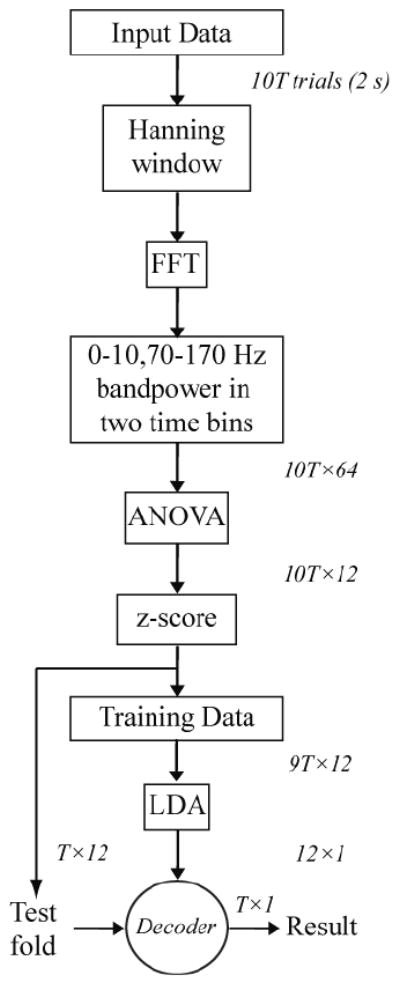
Figure 1.

Flow chart for feature extraction, selection, and decoding. Dimensions at each step are shown to the right or above the arrows. T, number of trials in one fold of cross-validation. The sequence from z-score to Result is repeated 10 times, once for each fold, and the results averaged to define the performance of each session.
