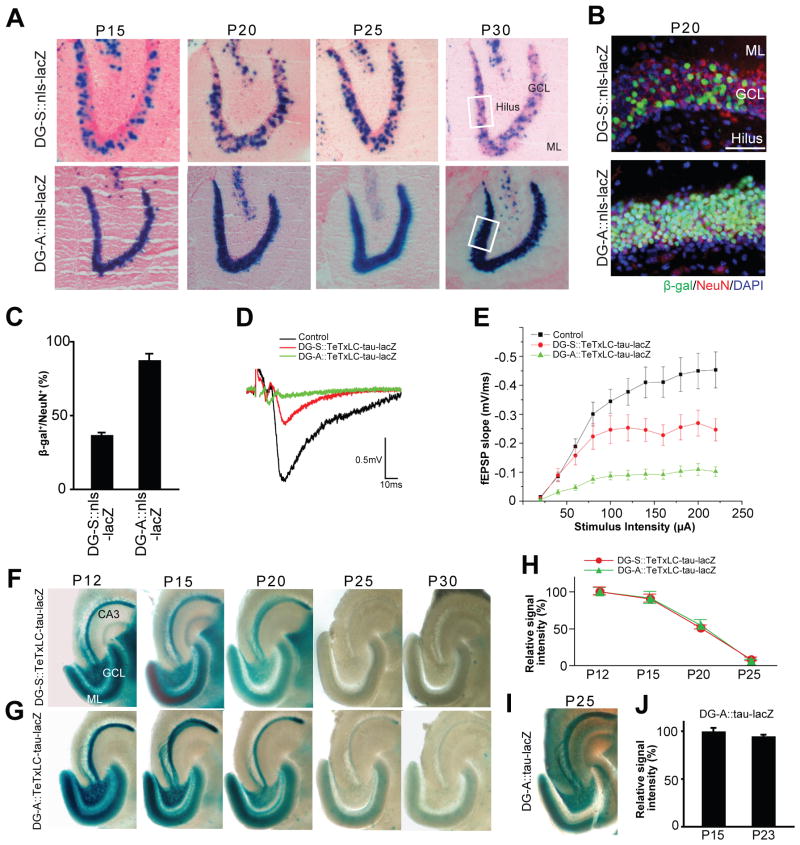
Figure 3. Activity-Dependent Elimination of Inactive DG Axons in Two tTA Lines that Express tTA in Different Numbers of DG Neurons.
(A) Developmental expression patterns of tTA in the DG of two tTA lines, DG-S and DG-A. Expression patterns were examined by mating the DG-S and DG-A mouse with the nls-lacZ mouse. LacZ-stained horizontal sections between P15 and P30 are shown. Nuclei of tTA-expressing cells are stained in blue. In DG-S::nls-lacZ mice less than half of dentate neurons in the granule cell layer (GCL) express tTA, while in DG-A::nls-lacZ mice almost all dentate neurons do. Between P15 and P30, the percentage of tTA-expressing cells in the GCL was not changed in either transgenic mouse. ML, molecular layer.
(B) Immunostaining of DG sections from DG-S::nls-lacZ and DG-A::nls-lacZ mice for β-gal (green) and NeuN (red); nuclear DAPI staining is shown in blue. Pictured areas correspond to the boxed areas in (A). β-gal positive cells in the DG of both bitransgenic mice are NeuN positive, indicating that they are mature neurons. Scale bar is 50 μm.
(C) Percentage of β-gal positive neurons in the DG of DG-S::nls-lacZ and DG-A::nls-lacZ mice. Bars are mean ± SEM. Data are from 8 (DG-S) and 4 (DG-A) mice.
(D and E) Evoked fEPSPs were recorded in acute slices from CA3 of DG-A::TeTxLC-tau-lacZ, DG-S::TeTxLC-tau-lacZ, and control mice (P15–P17). (D) Sample traces of fEPSP recordings. (E) Input-output curves. Input-output relationships were measured by varying the stimulus input intensity and measuring the fEPSP slope. 32 slices from DG-A::TeTxLC-tau-lacZ, 22 slices from DG-S::TeTxLC-tau-lacZ, and 52 slices from control mice. Each was from at least 5 mice. Relative to control mice, the fEPSP slope was decreased by ~80% and ~44% in the DG-A::TeTxLC-tau-lacZ and DG-S::TeTxLC-tau-lacZ mice, respectively.
(F and G) Developmental elimination of inactive DG axons. DG-S (F) and DG-A (G) mice were mated with TeTxLC-tau-lacZ mice to inactivate tTA-expressing neurons. Horizontal sections of the hippocampus from P12 to P30 were lacZ-stained. In both bitransgenic mice, inactive axons from the DG neurons still projected to CA3 by P12 (F and G). In DG-S::TeTxLC-tau-lacZ mice, in which a moderate number of DG neurons express TeTxLC, inactive axons were eliminated by P25 (F). In DG-A::TeTxLC-tau-lacZ mice, in which almost all DG neurons are inactivated, inactive axons were also eliminated by P25 (G).
(H) Quantification of the lacZ-staining intensity in the stratum lucidum layer of CA3 from P12 to P25. Data are shown as percentage of corresponding P12 mice. Data are mean ± SEM. The numbers of mice analyzed were: DG-A::TeTxLC-tau-lacZ, P12, 6 mice; P15, 5 mice; P20, 5 mice; P25, 5 mice; DG-S::TeTxLC-tau-lacZ, P12, 5 mice; P15, 5 mice; P20, 5 mice; P25, 5 mice.
(I and J) Maintenance of lacZ-expressing DG axons in DG-A::tau-lacZ (no TeTxLC) mice during development. (I) A horizontal section of the hippocampus from P25 DG-A::tau-lacZ mice was lacZ -stained. Active axons from DG neurons remained in CA3 at P25. (J) Horizontal sections from P15 and P23 DG-A::tau-lacZ mice were immunostained with the anti-β-gal antibody, and the staining intensity in the hilus was quantified. Intensities are normalized against the intensity of P15 mice. Bars are mean ± SEM. Data are from 5 mice.

