Fig. 2.
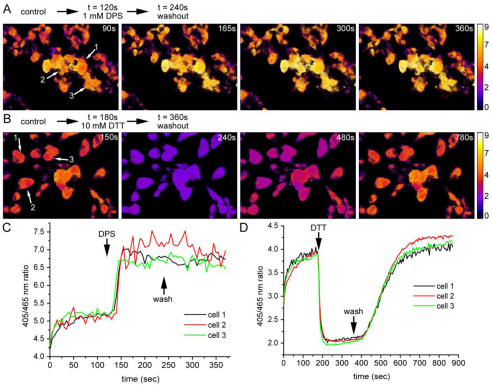
Real-time imaging of dynamic changes in ER redox state. (A,B) HT1080 roGFP1-iL–KDEL cells were imaged using live-cell microscopy. The cells were excited sequentially at 405 and 465 nm, with emission detected at 510 nm. After background subtraction, a false-colour ratio image was created by dividing the 405 nm image by the 465 nm image. The cells were treated with DPS (A) or DTT (B) as indicated. (C,D) Ratio traces of indicated selected cells from A and B (arrows), respectively.

