Fig. 6.
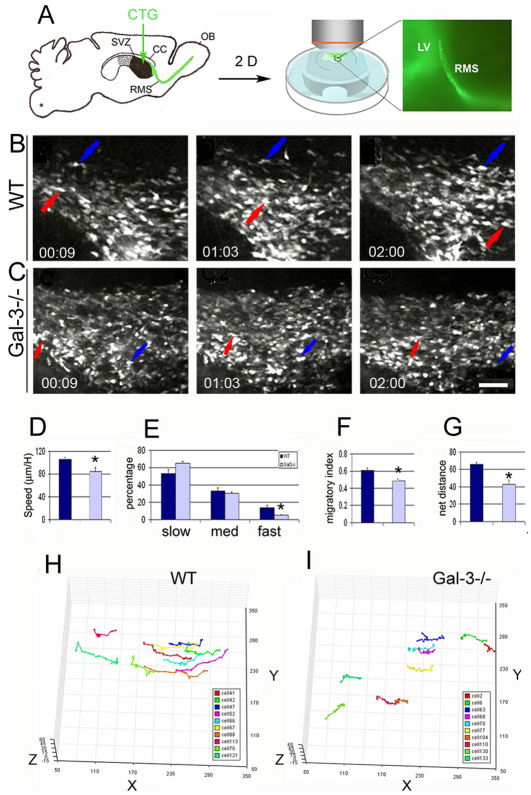
Two-photon time-lapse microscopy reveals slower and more complex motility in Gal3 null mice. (A) Cell tracker green was injected into the lateral ventricle and 2 days later neuroblast migration was analyzed at the RMS elbow in slices. Low-magnification photomicrograph on right shows CTG-labeled cells migrating in the RMS. (B) Still images from a two-photon time-lapse movie from a WT slice (supplementary material Movie 1). Colored arrows show the positions of two CTG-labeled neuroblasts. Time stamps are in hours:minutes. (C) Still images showing the positions of two CTG-labeled neuroblasts (colored arrows) in a Gal3−/− slice (supplementary material Movie 2). Scale bar: 50 μm. (D) Speed of migration is decreased in null mice compared with the WT. *P<0.05. (E) The percentage of migrating cells in the fast migratory phase is significantly decreased in null mice compared with the WT. *P<0.05. (F) The migratory index (net distance divided by total distance) is decreased in null mice compared with the WT. *P<0.05. (G) The net distance of migrating neurons is decreased in null mice compared with the WT. *P<0.01. (H,I) Tracks of individual neuroblast migration in WT and Gal3-null mice showing that null mouse neuroblasts exhibit decreased motility. Each color represents the path of a different cell. All error bars represent s.e.m.

