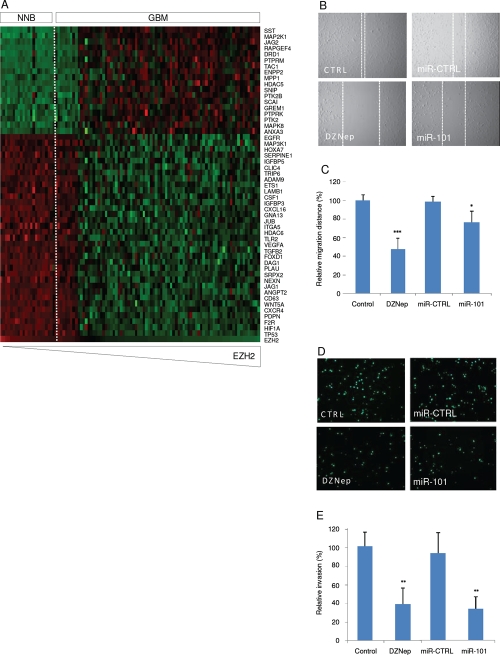
Figure 4: In silico analysis of EZH2 mRNA expression and the correlation to migration-related mRNAs.
Heatmap of percentile fold change of gene expression of migration-related genes sorted by correlation with EZH2 expression (rows) in patients sorted by level of EZH2 expression (columns). Color coding is similar to Fig 3A. (B) U87 monolayer cultures were scratched. Images were acquired directly after scratching (t = 0) and 24 h later (t = 24). The migration front is indicated by the dashed lines. Scale bar = 450 µm. (C) Quantitation of cell migration into the scratch using ImageJ software. (E and F) U87 cells were transfected with pre-miR-101, EZH2 siRNA, non-related control molecules, or treated with DZNep, and analyzed for invasion capability. EZH2 inhibition decreased invasion as shown by Hoechst staining. Error bars indicate s.d. *p<0.05, ***p<0.001, t test. Scale bar = 225 µm.

