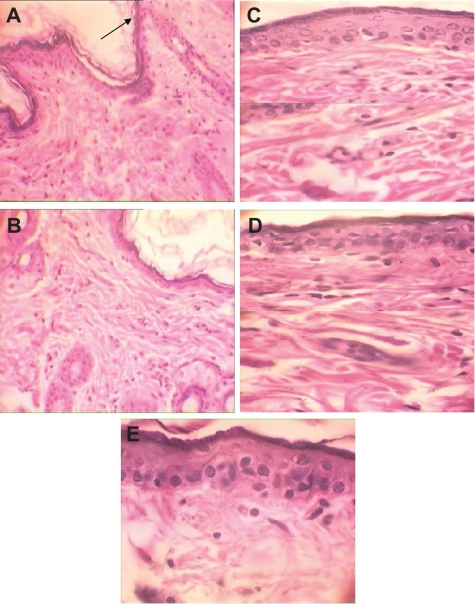
Figure 4.
H&E stained skin sections in subchronic toxicity (× 40). A) Normal skin in control group; B) AgNO3 group with reduced thickness of dermis and epidermis, increased Langerhans cells, inflammation, decreased thickness of papillary zone layer, and increased collagen levels of dermis layer; C) Skin abnormalities in low-dose nanosilver group; D) Skin abnormalities in high-dose nanosilver group; E) Highest level of dermal toxicity (see text for further details).

