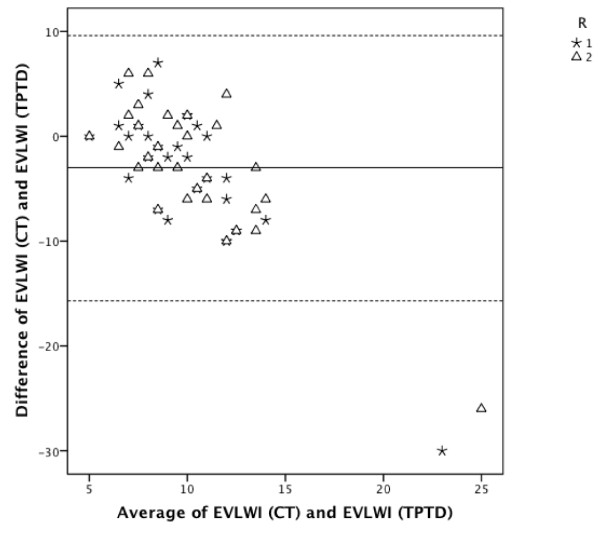
Figure 4.
CT-based EVLWI estimation compared to TPTD-derived EVLWI. Bland-Altman analysis. Bland-Altman figure showing individual agreement between radiographic estimation of EVLWI (EVLWI (CT)) and TPTD measurement of EVLWI (EVLWI (TPTD)). R1, radiologist 1; R2, radiologist 2. The middle line indicates the mean difference between variables determined using TPTD and radiographic estimation. The upper and lower dashed lines indicate the 95% limits of agreement (mean difference ± 1.96*SD).

