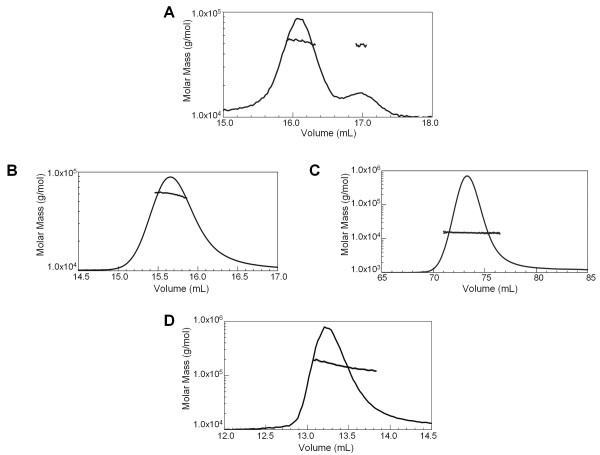
Figure 4.
Self-Association Properties of non-core RAG1 domains. MALLS-SEC analysis of the non-core RAG1 domains/regions. Molar mass distribution plots are shown for each non-core RAG1 region. The peaks represent the elution profile of the protein sample from a size exclusion column as monitored by a refractometer detector. The molar mass profile measured by light scattering (plotted versus the left axis) of the material that eluted at the corresponding volumes is overlaid on the elution profile. (A) The experimentally determined molar mass of MBP-RAG1(1-86) eluted from a 20 mL Superdex 200 column at 52,600 ± 500 Da (predicted MWt for monomeric MBP-RAG1(1-86) is at 52,815 Da). The molar mass for the species with the longer elution time is ~47 ± 1 kDa, which is consistent with that of the MBP portion of the fusion construct alone. (B) The predominant form of MBP-CND identified by SEC (see Figure 2E) was pooled, concentrated, and subjected to MALLS-SEC (using a 20 mL Superdex 200 column). The fusion construct eluted as a single species with an observed molar mass of 58,200 ± 700 Da (predicted monomeric MWt is at 58,400 Da). (C) Tagless CND (at a loading concentration of 23 μM) eluted from a 120 mL Superdex 75 column as a single species with an observed molar mass of 14,900 ± 300 Da (predicted monomeric MWt is at 15,317 Da). (D) MBP-bZDD eluted from a 20 mL Superdex 200 column with an observed molar mass of ~155 kDa (predicted dimeric MWt is at 123,634 Da).

