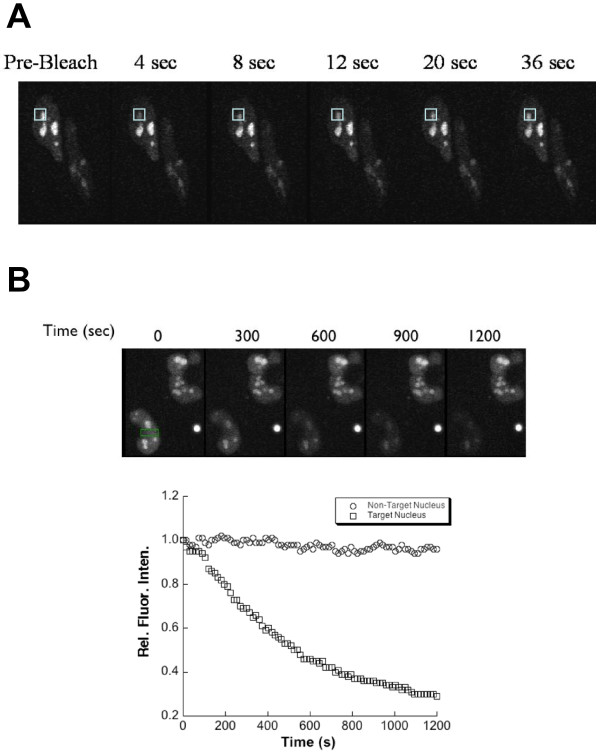
Figure 7.
Fluorescence photobleaching experiments of HeLa cells expressing GFP tagged to a non-core RAG1 region. (A) FRAP measurement of a HeLa cell expressing GFP-(CND+bZDD). The pre-bleach image was collected immediately before photobleaching the indicated region of the nucleus (box). Images were collected at the indicated times following photobleaching. Quantitative analysis of fluorescence intensity in the boxed region showed that the fluorescence signal recovered to 80% of its pre-bleached intensity by 12 s. (B) FLIP measurements of HeLa cells expressing GFP-(CND+bZDD). The fluorescent images of two separate cells expressing the GFP fusion protein are shown. The FLIP experiment was performed by repeatedly photobleaching the region indicated by the green rectangle (shown in leftmost image) as described in Methods. An image was collected following each bleach pulse (selected images from 300 to 1200 s after the initial pulse are shown). Plot: The loss of fluorescence intensity of the entire nucleus was measured in each frame and plotted versus frame number. As a control, the fluorescence intensity of the nucleus of the adjacent cell that was not photobleached was measured in parallel.

