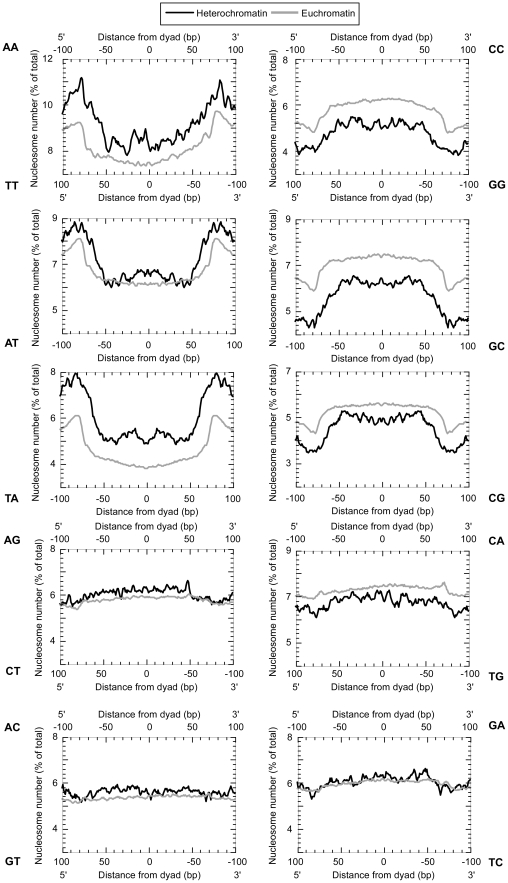
Figure 2. Dinucleotide frequency distribution.
The dinucleotide count was calculated for both the forward and reverse strands, reading from the 5′ to 3′ direction. The frequency distribution of one dinucleotide (e.g. 5′-AC-3′) plotted at the top from left to right is equal to its complement (e.g. 5′-GT-3′) reported from right to left at the bottom. Self-complementary dinucleotides are reported on only one axis.

