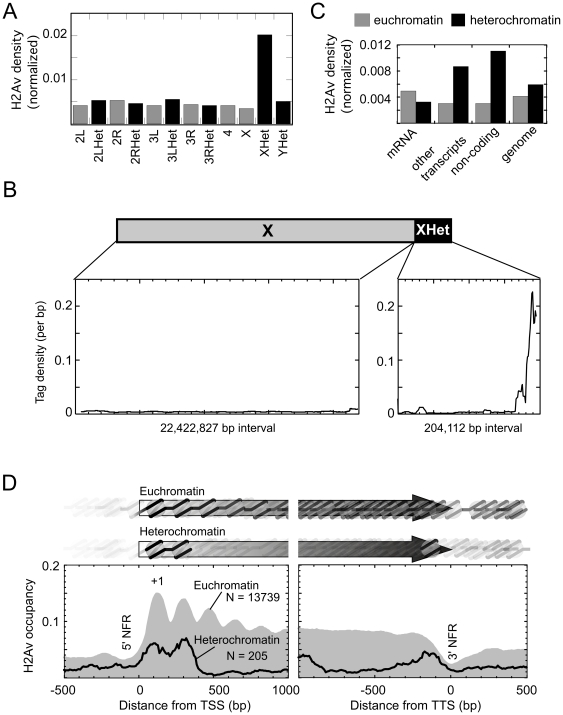
Figure 4. H2Av nucleosome density on chromosomes and organization at mRNA genes.
A, Weighted H2Av read counts were normalized to the amount of sequence present in each chromosomal region, and plotted. B, Nucleosomal DNA tag counts at each coordinates were plotted for both euchromatin and heterochromatin regions on the X chromosome. The height of blue bar indicates the total normalized tag count at each coordinate. Regions for euchromatin and heterochromatin is scaled differently along the X-axis. The Y-axis is on same scale. C, Euchromatin and heterochromatin genomes were divided into three categories: mRNA, other transcripts (tRNA, miRNA, transposons, etc), and non-coding regions. H2Av densities were calculated as total tag numbers divided by total base pair in all features in that particular category. D, Shown are a composite plots of the H2Av nucleosome occupancy distribution relative to TSSs (transcription start site, left panel) and TTSs (transcript termination site or polyA site, right panel) for the set of annotated heterochromatic and euchromatic genes. The number of genes included is indicated by N. Nucleosomal DNA read counts were weighted, binned, then normalized to the number of regions present in each bin, and plotted as a smoothed distribution. In order to represent a “pure” pattern, we removed those regions that were <300 bp from an adjacent TSS or TTS. Light gray-filled plot represents the distribution of reads in euchromatin. The black trace represents the distribution in heterochromatin.

