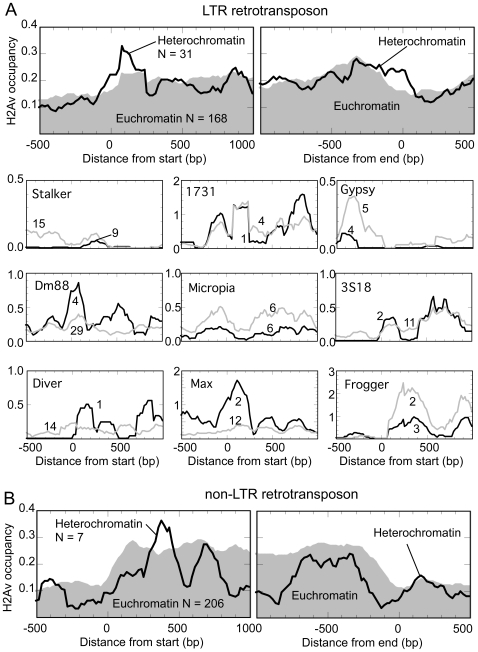
Figure 6. H2Av nucleosome organization flanking LTR and nonLTR retrotransposons.
A, Composite H2Av nucleosome occupancy distribution around the start (top left panel) or end (top right panel) of LTR elements. Euchromatic regions are plotted as gray fill, and heterochromatic regions as a black trace. N indicates the number of elements represented. The lower set of nine plots show the distribution of H2Av around the start of specific classes of LTRs. Numbers on the graph indicate the number of cases found, and are positioned closest to the trace it reflects. B, Composite H2Av nucleosome occupancy distribution around the start (left) or end (right) of non-LTR elements.

