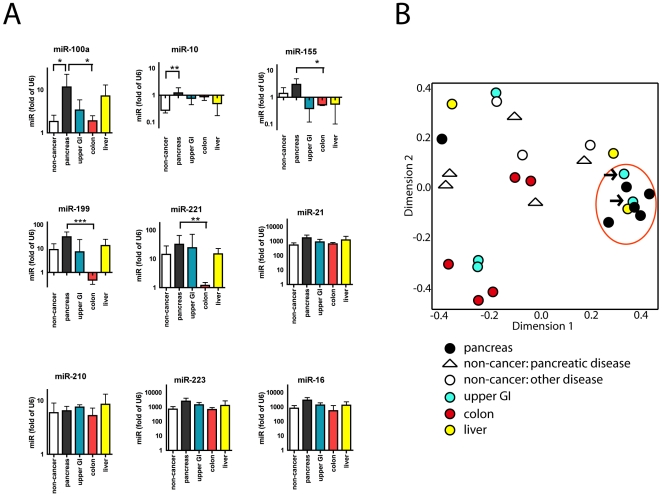
Figure 5. miRs detected in human plasma samples.
Samples were from pancreatic cancer patients, non-cancer controls, and patients with other GI cancers. (A) Concentrations of nine miRs detected in the circulation show individual differences between patients groups. Note the different ranges of the scales on the Y axes. (B) Unsupervised random forest analysis comparing pancreatic cancer (black circles) versus non-cancer controls with pancreatic disease (white triangle), non-cancer controls without pancreatic disease (white circles), upper GI cancer (blue circles), colon cancers (red circles), and liver cancers (yellow circles). Circled in red are the majority of the pancreatic cancers. Arrows indicate two specimen from patients with duodenal cancer. * p<0.05, ** p<0.01, *** p<0.001. Patient characteristics are provided in Table S2.

