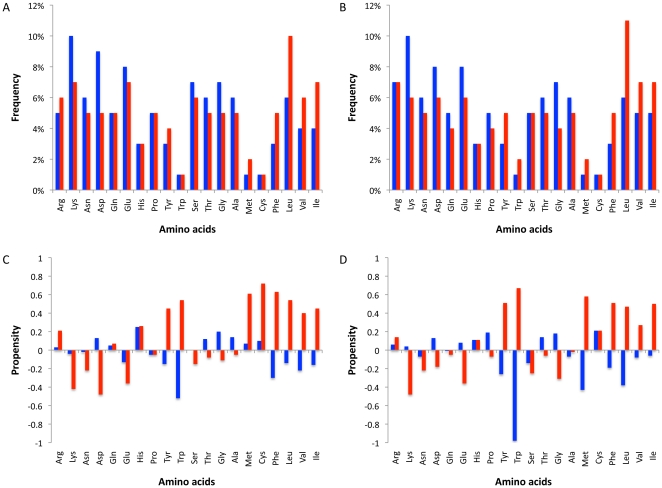
Figure 2. Amino acid composition of interfaces.
A. Frequency of residues in homocomplexes. B. Frequency of residues in heterocomplexes. C. Propensities of residues to be in the interface in homocomplexes. D. Propensities of residues to be in the interface in heterocomplexes. Blue bars correspond to the rim area, whereas red bars correspond to the interacting residues. Amino acids are sorted using Kyte and Doolittle table [46], which ranks residues according to their hydropathy. Frequency is based on the number of residues, whereas propensity takes into account the accessibility of each residue in the monomer.

