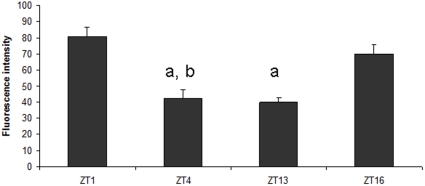
Figure 2. Cry-GAL4-driven GFP intensity measured at different time points (ZTs) in the 5th s-LNv cell body.
Means ± SEM, a and b mean statistically significant differences between ZT1 and ZT16, respectively, and other time points. Statistics: Non-parametric ANOVA Kruskal-Wallis Range Test [N = 21; H = 11.755; p = 0.083].

