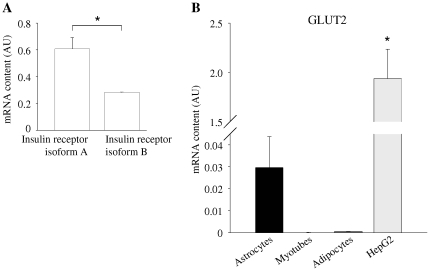
Figure 2. mRNA expression of insulin receptor isoforms A and B as well as GLUT 2 in human astrocytes.
(A) mRNA expression of insulin receptor isoform A and B in human astrocytes. Given are means + SEM, N = 3. * = there were significant differences between groups (Student's t-test, p = 0.0181). (B) mRNA expression of GLUT2 in human astrocytes (black bar), human myotubes (white bar), human adipocytes (dark grey bar), and HepG2 (human hepatocellular carcinoma cell line, light grey bar). mRNA expression was normalized for mRNA of the housekeeping gene Rps13. Bars represent means + SEM. N = 3. There were significant differences between the groups (ANOVA, p = 0.0006). * indicates significant difference from astrocytes (Tukey Kramer post hoc test p<0.05).

