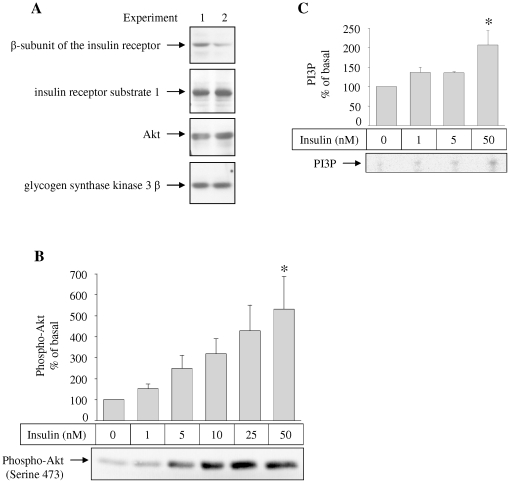
Figure 3. Protein expression, insulin-stimulated Akt phosphorlyation, and insulin-stimulated phosphatidylinositiol 3′-phosphorylation in human astrocytes.
(A) Equal amounts of total cell lysates of two independent experiments were loaded onto a SDS-PAGE gel. The indicated proteins were detected using specific antibodies. (B) Cells were stimulated with the indicated insulin concentrations for 15 minutes and lysed afterwards. Akt phosphorylation was detected by a phospho-specific antibody. A representative western blot is shown in the lower part. Bars in the diagram represent means + SEM. N = 6. There were significant differences between the groups (ANOVA, p = 0.0108). * indicates significant difference from 0 nM insulin (Tukey Kramer post hoc test p<0.05). (C) Following insulin stimulation with insulin for 30 minutes, cells were harvested, and lysates were immunoprecipitated with anti IRS-1 antibodies and a PI-3 kinase assay was performed using L-α-phosphatidylinositol as substrate. A representative image is shown in the lower part. Bars in the diagram represent means + SEM. N = 3. There were significant differences between the groups (ANOVA, p = 0.0267). * indicates significant difference from 0 nM insulin (Tukey Kramer post hoc test p<0.05).

