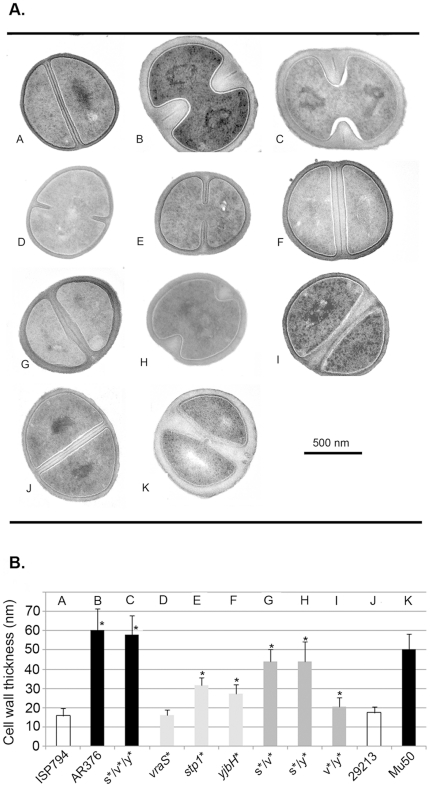
Figure 3. Cell wall thickness analysis.
(A) Transmission electron microscopy showing one representative image of each bacterial strain used in this study, after growth in the absence of antibiotic to post-exponential phase on TSB media. Magnification ×37,000. Scale bar automatically inserted by the microscope imaging system is shown. (B) Quantification of cell wall thickness (nm) of each bacterial strain. Reported values correspond to the mean ± SD (n = at least 40) of each bacterial strain. Asterisk (*) represents results significantly different by student's two-tailed t-test (p<0.05) from ISP794.

