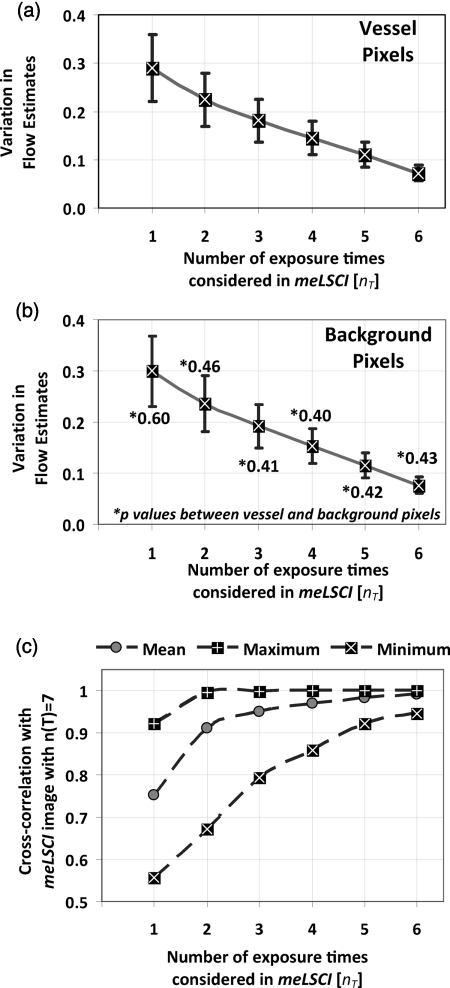
Figure 3.
Dependence of meLSCI images on the number of exposure times considered: (a,b) Dependence of the variation in flow estimates on the number of exposure times used in the meLSCI scheme. The mean and standard deviations have been calculated for data from five rats on five imaging days (25 cases in all). For each case, variation was calculated across all N images generated; that is, if number of exposure times used for meLSCI processing is denoted by nT, then for nT = 1, N = 7 (baseline LSCI); nT = 2, N = 21; nT = 3, N = 35; nT = 4, N = 35; nT = 5, N = 21; and for nT = 6, N = 7. Variation was calculated as normalized standard deviation of Afit (1/τc) values for every pixel across the N images. Results are shown differently for (a) vessel pixels and(b) background pixels though the variations in the two cases are very similar (p values of paired two-tailed t-tests between vessel and background pixels are indicated in (b). (c) The graph shows the cross-correlation between meLSCI images obtained at various values of nT with the image obtained at n(T) = 7. The cross-correlation was calculated for each of the N images generated at each value of nT and mean, maximum, and minimum cross-correlation across the N images was plotted for each nT. Note that while the maximum cross-correlation is very close to 1 even with nT = 2, suggesting two dominant exposure times, the minimum cross-correlation improves significantly suggesting that the robustness of meLSCI improves with increasing nT.

