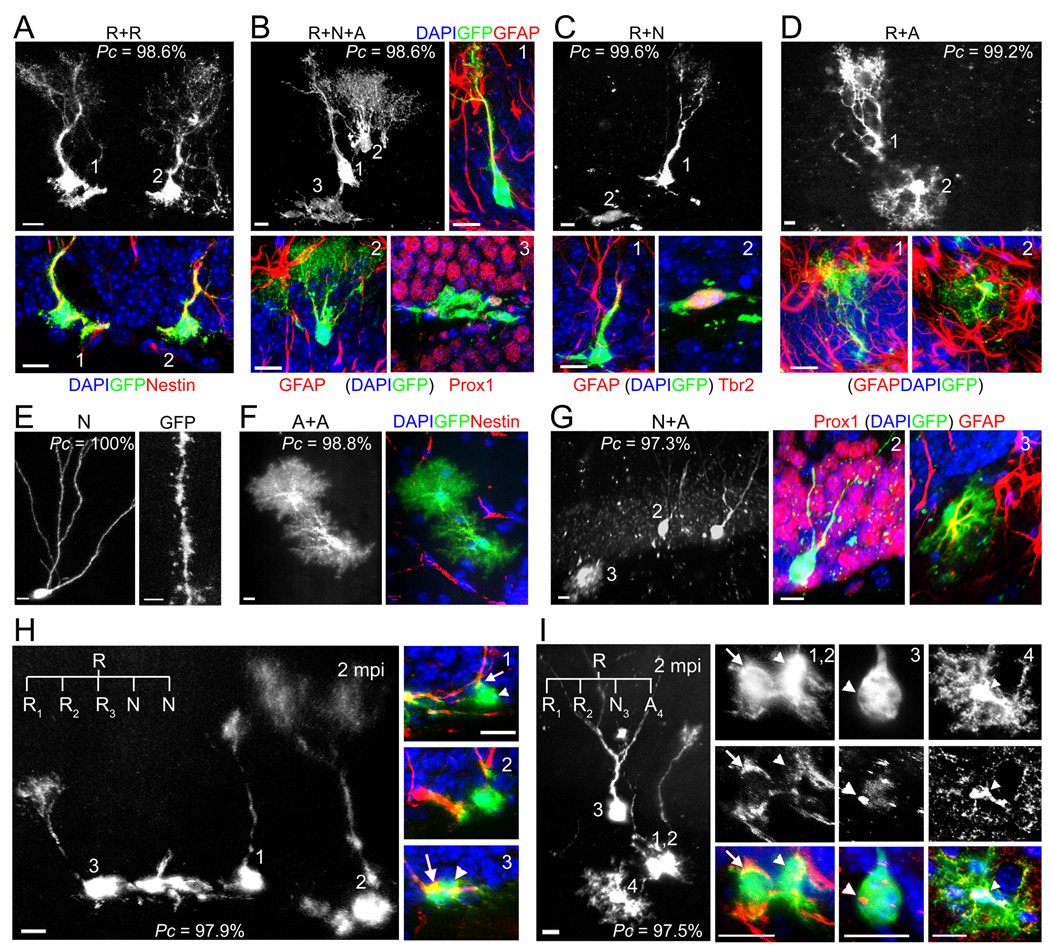
Figure 3. Clone classifications after long-term lineage-tracing of individual RGLs in the adult dentate gyrus.
(A–D) Sample confocal images of clones with active self-renewal. The clone in (A) consisted of two nestin+ RGLs, but no other cells, indicating symmetric self-renewal and an expansion of the RGL pool. The clone in (B) consisted of a GFAP+ RGL (1), a GFAP+ bushy astrocyte (2) and a cluster of 18 cells of the neuronal lineage (3), some of which expressed dentate granule cell marker Prox1, indicating self-renewal and multi-lineage differentiation (See 3D reconstruction in Movie S2). The clone in (C) consisted of a GFAP+ RGL (1) and Tbr2+ IPCs (2), indicating self-renewal and unipotential neurogenic differentiation. The clone in (D) consisted of a GFAP+ RGL (1) and a GFAP+ bushy astrocyte (2), indicating self-renewal and unipotential astrogenic differentiation. The Pc value for each clone is also shown. Scale bars: 10 µm.
(E–G) Sample confocal images of differentiated clones without an RGL. The clone in (E) consisted of a mature neuron with prominent dendritic spines (Scale bar: 2 µm). The clone in (F) consisted of two nestin− bushy astrocytes. The clone in (G) consisted of two Prox1+ neurons (2) and one GFAP+ stellate astrocyte (3). Scale bars: 10 µm.
(H) Sample confocal images of a clone indicating multiple rounds of self-renewal within two months. The clone consists of three nestin+ RGLs (1, 2, 3) and two IPCs. Scale bars: 10 µm. The potential lineage relationship is illustrated in Figure S3A.
(I) Sample confocal images of a clone indicating multiple modes of self-renewal and multi-lineage differentiation within the two month period, including symmetric, neurogenic asymmetric and astrogliogenic asymmetric self-renewal. The clone consisted of two nestin+ RGLs (1, 2), one Prox1+ mature neuron with elaborate dendritic arborization (3), and one S100β+ stellate astrocyte (4). Scale bars: 10 µm. The potential lineage relationship is illustrated in Figure S3B.

