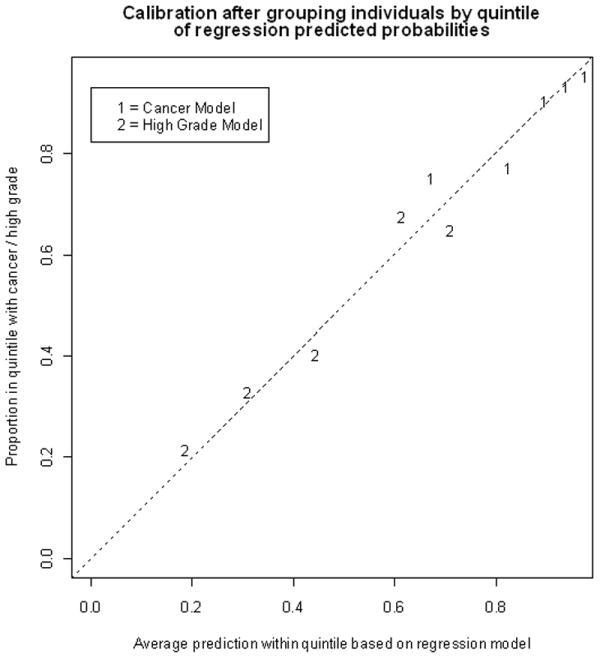
Fig. 1.

– Calibration after grouping individuals by decile of regression predicted probabilities. Area under the curve (AUC) for cancer model: 0.76; AUC for grade model: 0.73.
In a well calibrated plot, the points would lie on the dashed line. This model is well calibrated. AUC = area under the curve
