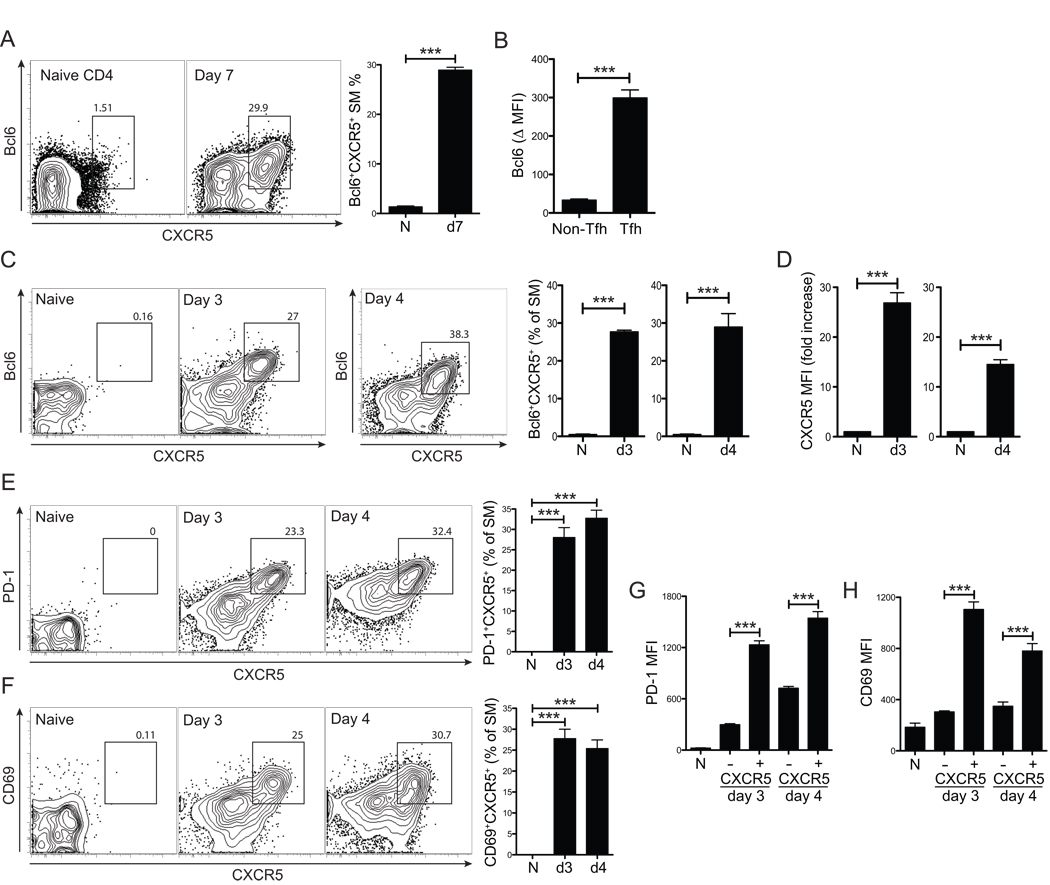
Figure 1. Bcl6+CXCR5+ Tfh cell differentiation occurs within 72 hours in vivo.
(A–D) LCMV-specific SM CD4+ T cells were transferred into B6 mice that were subsequently infected with LCMV. (A) Bcl6+CXCR5+ Tfh cells analyzed 7 days post-infection (p.i.) (“d7”) vs. naïve (“N”, CD44loCD62hi) CD4+ T cells of uninfected control mice. (B) Bcl6 protein expression in d7 SM as Δ MFI (e.g. Bcl6 MFITfh - Bcl6 MFInaiveCD4). (C) Bcl6+CXCR5+ Tfh cells, 3 and 4 days p.i. (“d3”, “d4”). “N”, uninfected mice. FACS plot shows SM CD4+ T cells. (D) Increase in SM CXCR5 MFI compared to that of naive (CD44loCD62hi) CD4+ T cells of uninfected mice. (E–H) Day 3 and 4 after LCMV infection, PD-1 (E) and CD69 (F) co-expression with CXCR5 on SM CD4+ T cells. (G) PD-1 and (H) CD69 MFIs of CXCR5+ SM vs. CXCR5− SM. Data are representative of three or more independent experiments; n = 4 per time point for all panels. *** P<0.001.

