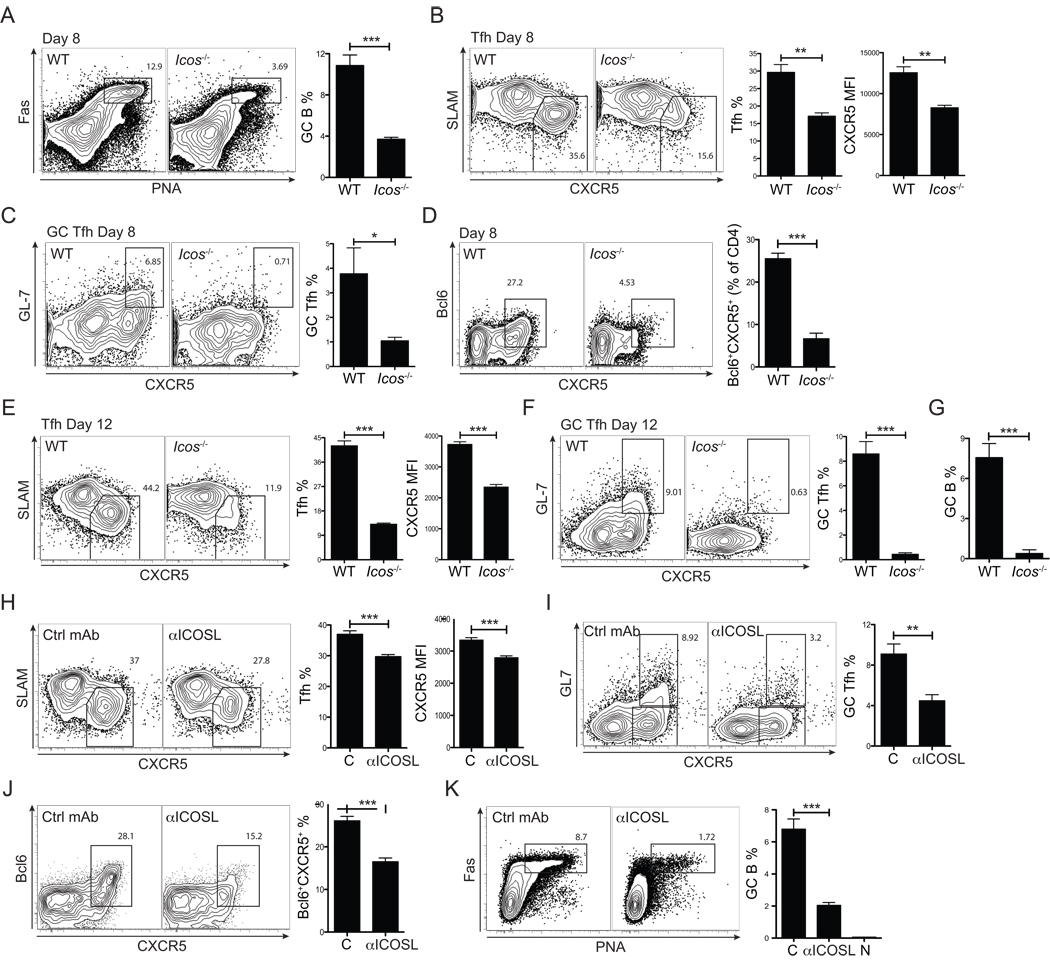
Figure 4. ICOS-dependent Tfh cell maintenance and germinal center formation.
B6 and Icos−/− mice were infected with vaccinia virus (VACV). Mice were analyzed 8 days p.i. (A–D) and 12 days p.i. (E–G). (A) Representative FACS plots of germinal center B cells (Fas+PNA+). Total B220+ B cells are shown. Right, GC B cells were quantified as % of total B cells. (B) Representative FACS plots of WT and Icos−/− polyclonal Tfh cells. Activated CD4+ T cells (CD44hiCD62Llo) are shown and gates identify SLAMloCXCR5+ Tfh cells. Tfh cell frequencies (% of activated CD4+ T cells (CD44hiCD62Llo)) and CXCR5 MFIs were quantified. (C) Representative FACS plots of WT and Icos−/− polyclonal GC Tfh cells. Activated CD4+ T cells (CD44hiCD62Llo) are shown and gates identify GL7+CXCR5hi GC Tfh cells. GC Tfh cell frequencies were quantified (% of activated CD4+ T cells (CD44hiCD62Llo)). (D) Representative FACS plots of Bcl6 expression by CD4+ T cells in B6 and Icos−/− mice. Bcl6+CXCR5+ Tfh cells were quantified (% of activated CD4+ T cells). Tfh cells (E), GC Tfh cells (F), and germinal center B cells (G) were analyzed 12 days p.i., as for day 8 (A–C). Data are representative of two independent experiments for day 8 and day 12; n = 4 per group. (H–K) B6 mice were infected with VACV and treated with anti-ICOSL (αICOSL) or isotype control mAb at day 3, 5, and 7 as schematically shown in Figure S4E. Tfh cells (H), GC Tfh cells (I), Bcl6 expression (J), and GC B cells (K) were analyzed 8 days p.i. “C” = isotype control mAb treated mice. “αICOSL” = anti-ICOSL treated mice. “N” = naïve uninfected mice. n = 5–6 per group. Data are representative of two independent experiments. *P<0.05, **P<0.01, ***P<0.001.

