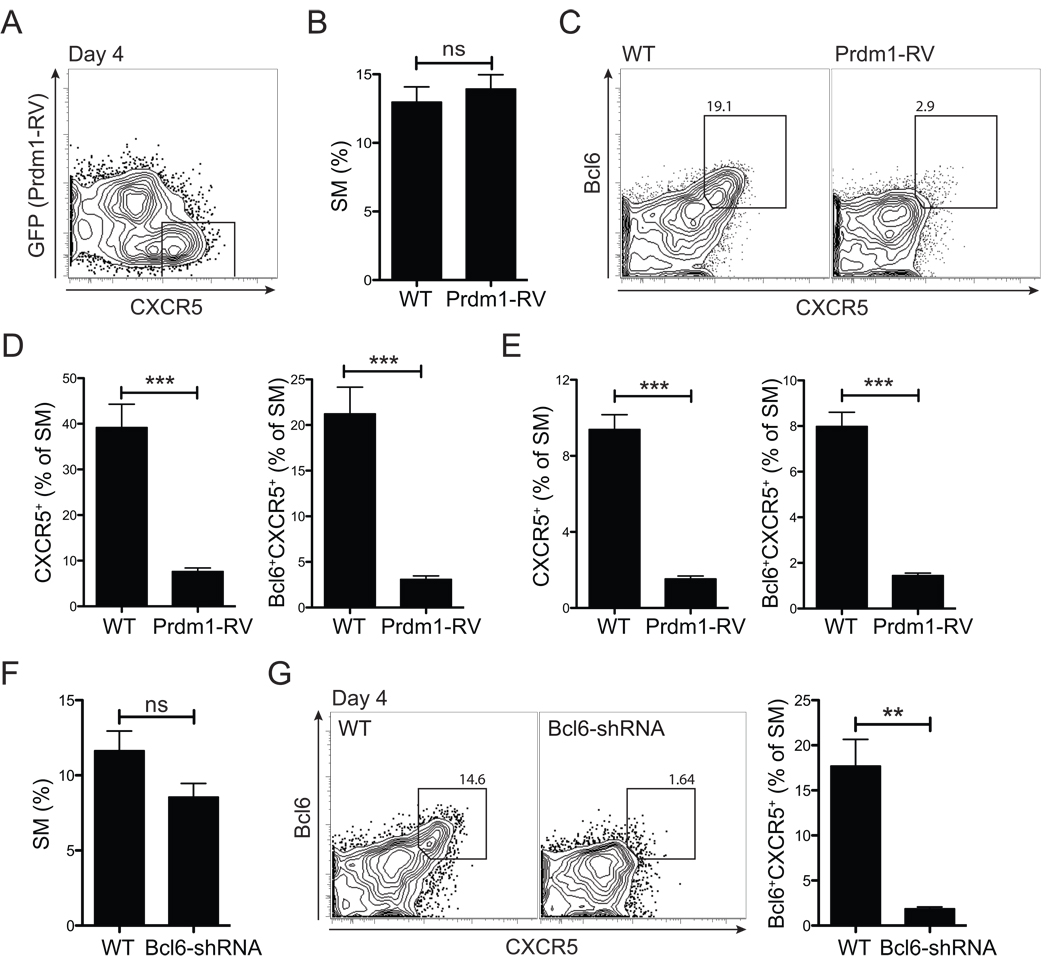
Figure 5. ICOS → Bcl6 → CXCR5.
(A–E) Blimp1 expressing (Prdm1-RV+, GFP+) and non-transduced (GFP) SM CD4+ T cells were transferred into the same (A) or separate (B–E) B6 recipient mice. (A) SM CD4+ T cells at day 4 after LCMV infection. (B) WT SM vs. Prdm1-RV+ SM CD4+ T cell expansion (% of total CD4+ T cells). (C, D) CXCR5 expression by Prdm1-RV+ SM and WT SM, day 4 p.i. (C) Representative FACS plots showing WT (GFP) and Prdm1-RV+ (GFP+). Gates identify CXCR5+Bcl6+ SM. (D) Quantitation of CXCR5+ and CXCR5+Bcl6+ SM. (E) CXCR5+ SM and Bcl6+CXCR5+ Tfh cell frequencies day 3 p.i. (F, G) Bcl6 shRNA-RV+ (GFP+Ametrine+) and non-transduced (GFP−Ametrine) SM CD4+ T cells were transferred into separate B6 recipient mice subsequently infected with LCMV. (F) SM CD4+ T cell expansion, day 4 p.i. (% of total CD4+ T cells). (G) Representative FACS plots of CXCR5 and Bcl6 expression by WT SM and Bcl6 shRNA+ SM CD4+ T cells. Total SM cells are shown and gates identify Bcl6+CXCR5+ SM. Data are representative of three (A–E) and two (F–G) independent experiments; n = 4 per group per time point. **P<0.01, ***P<0.001.

