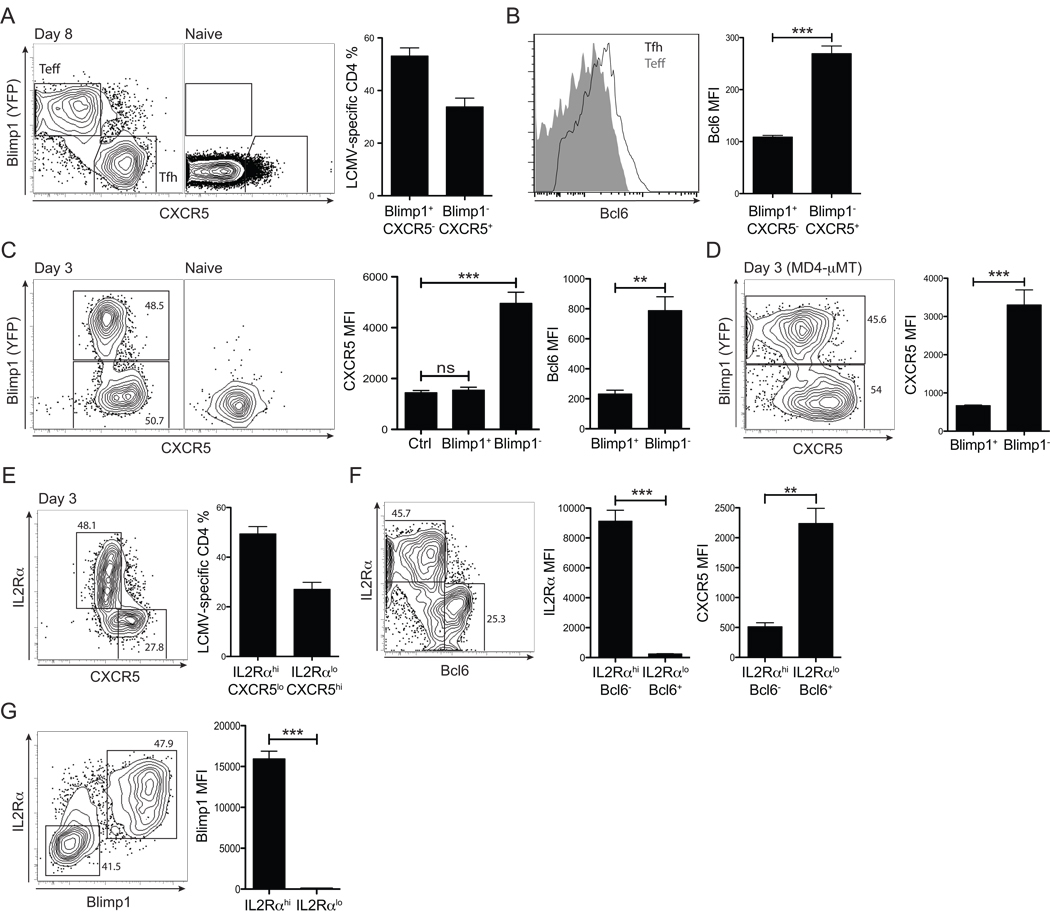
Figure 6. Rapid Bcl6 versus Blimp-1 bifurcation of CD4+ T cell differentiation in vivo.
(A) Blimp1 and CXCR5 expression by Blimp1-YFP BAC tg SM CD4+ T cells was analyzed at 8 days p.i. in B6 recipient mice. Gates identify Blimp1+CXCR5− effector Th cells and Blimp1−CXCR5+ Tfh cells. (B)Left, Bcl6 expression in Blimp1+CXCR5− (gray filled) vs. Blimp1CXCR5+ (black line) SM CD4+ T cells. Right, Bcl6 MFIs. (C) Day 3 p.i., analysis of Blimp1, Bcl6, and CXCR5 expression by Blimp1-YFP BAC Tg SM CD4+ T cells in B6 recipients. Representative FACS plots of SM cells from LCMV infected (“Day3”) and uninfected (“Naïve”) recipients are shown. CXCR5 and Bcl6 expression by Blimp1+ vs. Blimp1− SM CD4+ T cells were quantified. “Ctrl” = isotype control stain. (D) MD4-µMT recipient mice of Blimp1-YFP BAC tg SM CD4+ T cells, day 3 p.i. Representative FACS plot of SM cells and CXCR5 quantitation. (E–G) Blimp1-YFP SM CD4+ T cells were transferred into B6 recipients and analyzed for IL2Rα expression 3 days after LCMV infection. IL2Rαhi vs. IL2Rαlo SM CD4+ T cells are identified in co-stains with CXCR5 (E), Bcl6 (F), and Blimp1 (G). Data in all panels are representative of three or more independent experiments; n = 3–4 per group. **P<0.01, ***P<0.001.

