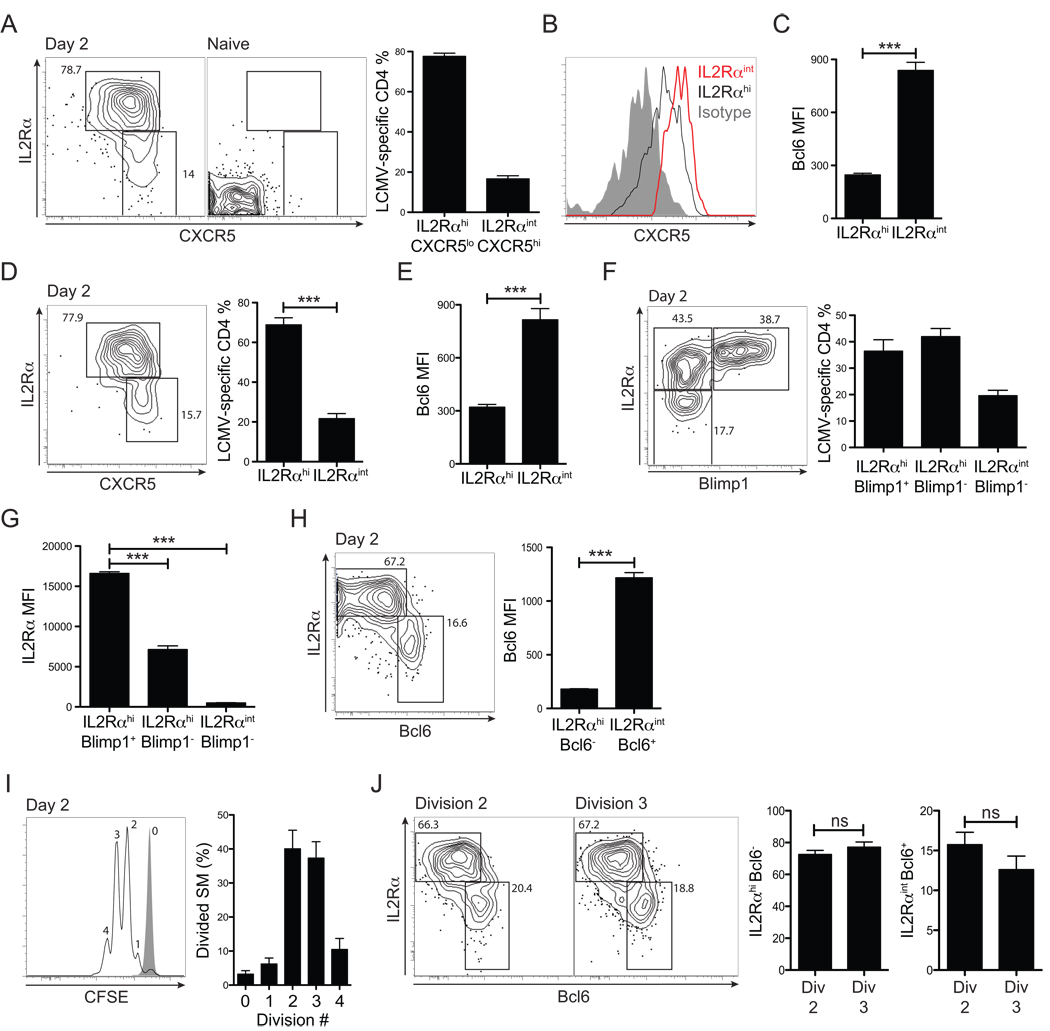
Figure 7. Tfh versus effector Th cells are distinguishable by the second cell division, in association with differential early IL-2Rα expression levels.
Early virus-specific Tfh vs. effector Th cell differentiation was analyzed at 48 hrs after acute LCMV infection. (A) Representative FACS plots of SM CD4+ T cells from LCMV infected (“Day 2”) and uninfected (“Naïve”) mice. Gates identify IL2RαhiCXCR5lo vs. IL2RαintCXCR5hi SM CD4+ T cells. (B) CXCR5 expression by IL2Rαhi (black) vs. IL2Rαint (red) SM CD4+ T cells. Isotype control = gray filled histogram. (C) Bcl6 expression by IL2Rαhi vs. IL2Rαint SM CD4+ T cells. (D) Expression of IL2Rα and CXCR5 by SM CD4+ T cells in MD4-µMT recipients, day 2 p.i. (E) Bcl6 expression by SM CD4+ T cells in MD4-µMT recipients, day 2 p.i. (F) IL2Rα and Blimp1 expression by Blimp1-YFP SM CD4+ T cells in B6 recipients, day 2 p.i. Representative SM CD4+ T cell FACS plot and quantitation are shown. (G) IL2R α expression (MFI) by SM CD4+ T cell populations gated in (F). (H) Bcl6 expression by SM CD4+ T cells in B6 recipients at day 2 p.i. Gates identify IL2Rαhi vs. IL2Rαint SM CD4+ T cells. Bcl6 protein expression (MFI) by each population was calculated. (I, J) CFSE-labeled SM CD4+ T cells were transferred into B6 recipient mice subsequently infected with LCMV. Cell divisions and differentiation were analyzed at day 2 p.i. (I) Cell divisions. Gray filled histogram = SM CD4+ T cells in uninfected mice. (J) Representative FACS plots are shown of SM CD4+ T cells that have undergone 2 (left) and 3 (right) cell divisions. Gates identify IL2RαhiBcl6− and IL2RαintBcl6+ SM CD4+ T cells. Data in all panels are representative of three or more independent experiments; n = 3–4 per group. **P<0.01, ***P<0.001.

