

Abstract
A novel hydrodynamic injector that is directly controlled by a pneumatic valve has been developed for reproducible microchip capillary electrophoresis (CE) separations. The poly(dimethylsiloxane) (PDMS) devices used for evaluation comprise a separation channel, a side channel for sample introduction, and a pneumatic valve aligned at the intersection of the channels. A low pressure (≤ 3 psi) applied to the sample reservoir is sufficient to drive sample into the separation channel. The rapidly actuated pneumatic valve enables injection of discrete sample plugs as small as ~100 pL for CE separation. The injection volume can be easily controlled by adjusting the intersection geometry, the solution back pressure and the valve actuation time. Sample injection could be reliably operated at different frequencies (< 0.1 Hz to >2 Hz) with good reproducibility (peak height relative standard deviation ≤ 3.6%) and no sampling biases associated with the conventional electrokinetic injections. The separation channel was dynamically coated with a cationic polymer, and FITC-labeled amino acids were employed to evaluate the CE separation. Highly efficient (≥ 7.0 × 10³ theoretical plates for the ~2.4 cm long channel) and reproducible CE separations were obtained. The demonstrated method has numerous advantages compared with the conventional techniques, including repeatable and unbiased injections, little sample waste, high duty cycle, controllable injected sample volume, and fewer electrodes with no need for voltage switching. The prospects of implementing this injection method for coupling multidimensional separations, for multiplexing CE separations and for sample-limited bioanalyses are discussed.
Keywords: Hydrodynamic injection, Microchip electrophoresis, Microfluidics, Pneumatic valve, Repeatable injection
1 Introduction
Capillary electrophoresis (CE) is the most commonly employed separation technique for lab-on-a-chip analyses [1-9] as it enables rapid, efficient separations with minimal reagent consumption. Because the size of the initial injected plug can strongly impact the overall separation efficiency, sample introduction and injection play a crucial role in microchip CE performance. Presently, “pinched” electrokinetic injection is the most commonly used method due to its ability to generate very small, well defined sample plugs [7, 9-10]. For pinched injection, voltages applied at the ends of two intersecting channels are first manipulated to drive sample across the intersection to a waste reservoir. By switching the applied voltages, the sample present at the intersection can be injected into the separation channel while the rest of the sample in the channels is sent to the sample and waste reservoirs. There are several limitations to the pinched sample injection method. For example, to avoid mobility biases, the sample loading step must be given sufficient time so that the lowest mobility species achieves a steady state at the intersection. These extended sample loading times can limit the duty cycle between repeated injections. In addition, loading the sample for extended periods can also introduce biases, as higher mobility species will be depleted from the sample reservoir more rapidly than low-mobility species. Finally, the amount of analyte loaded into the sample reservoir is typically orders of magnitude greater than the subnanoliter sample plugs actually injected for separation, leading to extremely poor sample utilization efficiency. This discrepancy can hinder the application of microchip CE to the analysis of trace biological samples. An alternative electrokinetic approach is “gated” sample injection [11-12], in which variable sample volumes are introduced by adjusting the sample loading time. Gated injections can achieve a high duty cycle, but sampling biases are more severe than for pinched injection.
Given the limitations associated with electrokinetic injection, a number of hydrodynamic or pressure-driven injection methods have been explored for microchip CE separations. These have utilized a number of different mechanisms for sample introduction, including hydrostatic pressure generated from the difference between liquid level height in two reservoirs [13-16], pulsed pressure produced using mechanical actuation of a PDMS membrane on a reservoir [17-18], pneumatic pressurization of reservoirs [19], negative pressure applied on the sample waste reservoir using a syringe pump [20-21], hydrodynamic flow-through injection using a syringe pump [22], pneumatic pressure-driven injection based on the hydrophobicity and wettability of channel surfaces [23], and hydrodynamic fluid pulses in the channel network created using miniaturized and integrated dielectric elastomer actuators [24-25]. In one notable example, Martin and coworkers developed a PDMS microdevice with an integrated pneumatic valve, which injected discrete sample plugs from a hydrodynamically pumped continuous-flow stream or an on-chip reservoir integrated with peristaltic pumps into a separation channel for subsequent electrophoretic separation [26-27]. These injection systems included a pushback channel to flush away stagnant sample associated with the injector dead volume. The effect of the valve actuation time, the pushback voltage and the sampling stream flow rate on the injection performance was evaluated. The injection process was reproducible, but the use of a pushback channel increased the system complexity, and the application of a pushback voltage could lead to sampling biases associated with electrokinetic behavior. To date, many pressure-driven injection mechanisms have demonstrated the ability to effectively overcome the biases and duty cycle limitations of electrokinetic injection, but none has demonstrated the ability to deliver small analyte plugs for well defined injections without wasting the majority of the sample.
In this work, we have developed a simple sample injection method for microchip CE that overcomes the bias, duty cycle and sample utilization limitations of existing techniques. A PDMS-based microchip was fabricated using multilayer soft lithography [28], which contained a T-shaped channel on the flow layer and a valving channel on the control layer. Hydrodynamic injection was controlled by a zero-dead-volume pneumatic valve positioned at the intersection of the sample introduction and separation channels. By briefly opening the valve, sample was pressure driven onto the separation channel, where high voltage for CE separation was continuously applied. The effect of valve actuation time, sample injection pressure, valve control pressure and valve actuation frequency on the injection performance has been evaluated. Efficient, repeatable and unbiased CE separations were achieved over extended periods of time (hundreds of analyses). Importantly, this new injection method has essentially no sample waste, which makes it promising for high-throughput analyses of expensive or rare samples.
2 Materials and methods
2.1 Materials
Ammonium acetate was purchased from Fisher Scientific (Fair Lawn, NJ). Aspartic acid (Asp), glycine (Gly), phenylalanine (Phe), arginine (Arg), sodium carbonate, sodium bicarbonate, acetic acid (≥ 99.99%), hexamethyldisilazane (HMDS), dimethyl sulfoxide (DMSO, ≥ 99.9%), fluorescein 5(6)-isothiocyanate (FITC, ~90%), hydroxypropyl cellulose (HPC, average MW ~100,000) and 1,2-bis(3-aminopropylamino)ethane (94%) were purchased from Sigma-Aldrich (St. Louis, MO). Fluorescein and epichlorohydrin (98%) were obtained from Fluka (Buchs, Switzerland). Water was purified using a Barnstead Nanopure Infinity system (Dubuque, IA). Carbonate buffer (10 mM, pH 9.3) and ammonium acetate buffer (10 mM, pH 7.0) were filtered using 0.2 μm syringe filters (Pall Life Sciences, Ann Arbor, MI) before use. PDMS elastomer base and curing agent were purchased as Sylgard 184 from Dow Corning (Midland, MI).
All amino acids were labeled with FITC for laser-induced fluorescence (LIF) detection as reported elsewhere [9]. Briefly, a 6 mM FITC solution was prepared in DMSO and 3 mM amino acid solutions were prepared in 10 mM carbonate buffer (pH 9.3). Then 600 μL of each sample solution was mixed thoroughly with 200 μL of FITC solution. All solutions were allowed to react in the dark for 48 h at room temperature and then stored at 4 °C. The FITC-labeled samples were diluted with 10 mM carbonate buffer (pH 9.3) containing 0.5% (w/v) HPC before use.
2.2 Microchip design and fabrication
Figure 1A shows the outline of the microchip structure, which is composed of two layers. The flow layer contains a simple T-shaped microchannel (solid line), and the control layer contains a microchannel for valving (dashed line). The width of all channels is 100 μm. The lengths of the separation and injection channels are 3 cm and 0.5 cm, respectively. The channel on the control layer crosses over the sample injection channel, and the intersectional area (100 μm × 100 μm) is large enough for a pneumatic valve to function properly [29]. A thin PDMS elastomer membrane was integrated between two microchannel layers and acted as a pneumatic valve which was actuated by pressure.
Figure 1.

Illustration of the microchip design and fabrication. A) Design of the microchip including flow channel (solid line) and control channel (dashed line). B) Schematic of the microchip fabrication. (a) Flow layer containing the sample injection and separation channels. (b) Control layer containing the valving channel on a thin PDMS film. (c) Unpatterned bottom layer to enclose the control channel. C) Template for flow layer fabricated with positive photoresist. D) Template for control layer fabricated with SU-8. E) Photograph of the final PDMS microchip. F) Photograph of the T intersection assembled with a pneumatic valve.
The integrated PDMS microchips were fabricated using well established multilayer soft lithography techniques [28]. First, two separate templates were produced on silicon substrates using standard photolithographic patterning from photomasks that were designed using IntelliCAD software (IntelliCAD Technology Consortium, Portland, OR) and printed with 50,800 dpi resolution at Fineline Imaging (Colorado Springs, CO). The template defining the fluidic channels (flow layer) was formed by patterning SPR 220-7 photoresist (Rohm & Haas Electronic Materials, Marlborough, MA) and then reflowing the resist at 150 °C for 20 min to create rounded shape features (~ 10 μm high) as shown in Figure 1C. SU-8 photoresist (Microchem, Newton, MA) with rectangular cross-section features (~ 25 μm high) was patterned on another substrate to define the control layer (Figure 1D). The crosses shown in Figures 1C and 1D are alignment marks. The silicon template defining the control layer was modified with HMDS using vapor deposition to assist in releasing the PDMS membrane from the patterned template. A 10:1 ratio (w/w) of PDMS base to curing agent was then mixed, degassed under vacuum, and poured onto the patterned flow layer template to a thickness of 1–2 mm. The mixed and degassed PDMS was also spin-coated on the surface-modified control layer template at 2000 rpm for 30 s to achieve a thickness of ~ 50 μm. Both substrates were then cured in an oven at 75 °C for 2 h. The flow layer PDMS piece with a small through-hole at the end of the sample injection channel and two 3-mm-diameter holes at the ends of the separation channel was then bonded on the top of the control layer PDMS membrane using oxygen plasma treatment (PX-250; March Plasma Systems, Concord, CA). After curing at 75 °C for 2 h, the PDMS block containing flow and control layers with a hole at the end of the control channel was bonded to an unpatterned PDMS piece to enclose the control channel. The assembly of three layers to fabricate the microchip is illustrated in Figure 1B, in which the middle layer is a thin PDMS membrane containing the control channel. Figure 1E shows a picture of an assembled PDMS microchip; its T-junction section is shown in Figure 1F.
2.3 Microchip surface modification
PolyE-323 is a cationic polyamine, which can be adsorbed on a negatively charged surface through strong electrostatic interaction [30]. The polymer has been successfully employed to coat PDMS [31-32], glass [33] and fused silica [30, 34] surfaces to support strong and stable anodic electroosmotic flow (EOF). In this work, polyE-323 was used to coat the PDMS microchannel surfaces to provide EOF in the same direction as electrophoresis for the negatively charged analytes. To reduce analyte adsorption onto the modified surface resulting from the electrostatic interaction, all samples were prepared in a buffer solution containing 0.5% HPC. During the experiments, litter effect of HPC on EOF was observed because only a very small volume of sample (subnanoliter) was injected for separation each time. And the adsorption was significantly reduced. PolyE-323 was synthesized according to the procedure reported by Hardenborg et al. [30]. Briefly, 17.65 g 1,2-bis(3-aminopropylamino)ethane was mixed with 20 g water and 9.3 g epichlorohydrine during strong stirring. Two days later, 100 g water was added and the reaction was allowed to continue for 1 week at room temperature. Five mL of the polymer solution were then diluted in 25 mL of 0.2 M acetic acid, adjusting the pH to ~7. The diluted polymer solution was filtered using a 0.2 μm syringe filter (Pall Life Sciences, Ann Arbor, MI) and stored at 4 °C.
Approximately two hours after the PDMS microchip assembly with oxygen plasma treatment, the diluted polyE-323 solution was pumped into the separation channel through the sample introduction inlet for 10 min, and the solution was left in the channel for 30 min. The channel was then flushed with 10 mM ammonium acetate (pH 7) for 10 min to remove excess polymer. Thereafter, the microchip was filled with run buffer (10 mM carbonate buffer, pH 9.3) and ready for CE separation.
2.4 Microchip CE separation and detection
Figure 2 shows the schematic of the setup for microchip CE separation using pneumatic valve-controlled sample injection. The pneumatic valve was actuated by a computer-controlled external solenoid valve [35]. The valve controller and valve assembly were prepared as described at the Stanford Microfluidics Foundry website (www.stanford.edu/group/foundry). A home-written program was used to control the valve operation, and the actuation time and frequency could be set in the software. The valve control channel in the PDMS device could be filled with either water or air, but water was generally used to avoid introduction of bubbles into the flow channels [28]. The sample was contained in a sealed vial with an air inlet to pressurize the sample and an outlet allowing sample to be transferred into the microchannel through a fused-silica capillary (75 μm i.d., 360 μm o.d.; Polymicro Technologies, Phoenix, AZ). One end of the capillary was immersed into the liquid sample and the other end was inserted into a ~2 mm long section of Tygon tubing, which was then inserted into the through-hole of the sample injection channel on the microchip [36]. Before injection, any air bubbles trapped in the transfer line and microchannel were removed. When performing microchip CE separation, a high voltage (3 kV) was applied across the separation channel using a PS-350 high-voltage power supply (Stanford Research Systems, Sunnyvale, CA) via platinum electrodes placed in the reservoirs and a stable current was achieved. The pneumatic valve was actuated to inject discrete sample plugs into the separation channel for subsequent CE separation.
Figure 2.

Schematic of the experimental setup for microchip CE separation using hydrodynamic injection method with pneumatic valving.
The LIF system was employed for detection as reported elsewhere [7]. Briefly, a 488-nm line from an air-cooled Ar ion laser (Melles Griot Laser Group, Carlsbad, CA) was passed into an inverted optical microscope (Olympus, Tokyo, Japan), and the fluorescence was collected using a CCD camera (CoolSNAP ES2, Photometrics, Tucson, AZ). For imaging experiments, a mercury lamp (Olympus, Tokyo, Japan) was used as the light source and the fluorescence was collected with a digital camera (Nikon, Tokyo, Japan).
3 Results and discussion
3.1 Microchip design, fabrication and operation
The microchip used in this work has a simple design, which contains a single T-shaped channel on the flow layer and a single channel on the control layer with an integrated membrane as a pneumatic valve (Figure 1A). The fabrication of the microchips is based on multilayer soft lithography using “push up” valve technology [28]. The flow channel is designed with a rounded cross section to close the valve completely under a moderate gas pressure. The crucial part of the microchip is the interface between the sample injection channel and the separation channel. In this work, the control channel is assembled such that it crosses the side channel at the T-shaped intersection (Figure 1F) with the assistance of alignment marks to avoid any injection dead volume. When the valve is opened for a short time, a small volume of sample solution is pushed into the separation channel under a low applied pressure from the side channel. When the valve is closed, the sample solution is completely isolated from the buffer solution in the separation channel such that there is no risk of sample leakage during the sample CE separation, and a discrete, well defined sample plug is injected into the separation channel with each valve opening event.
A novel feature of the system is that no voltage switch is needed. The pneumatic valve actuation causes no significant hydrodynamic flow in the separation channel under a sufficiently low sample injection pressure, so the sample injection is independent of the CE separation. As such, a high voltage can be applied across the separation channel continuously. Because the sample is hydrodynamically injected into the separation channel for subsequent CE separation, there is also no delay time for producing a stable sample plug as with traditional pinched injection. Discrete sample plugs can be injected into the separation channel for simultaneous CE separations. The frequency of the sample injection is determined solely by the valve actuation time and the required CE separation time. The high duty cycle of the device makes it a promising candidate for continuous flow monitoring applications, high throughput analysis, and multiplexed (e.g., Hadamard transform [37]) separations. Additionally, this injection approach is capable of essentially 100% sample utilization. In standard injection methods, almost the entire sample flows into the waste reservoir and only a very small volume of sample is used for separation. While the present design still requires that a larger sample volume be loaded onto the device than can be analyzed in a single separation, the unused portion of the sample remains undiluted and available for immediate subsequent separations to improve detection limits or for other analyses. This feature will be advantageous when working with expensive, rare, or otherwise precious samples such as for proteomics analysis of tissue microbiopsy samples or even individual cells.
3.2 Repeatable hydrodynamic injection controlled by pneumatic valve
Figure 3 shows a sequence of micrographs to depict one cycle of sample injection controlled by the pneumatic valve. The sample injection pressure was 1.5 psi and the valve actuation time and frequency were 33 ms and 2.2 Hz, respectively. The valve control gas pressure was 30 psi. The microchannel surface was dynamically coated with PolyE-323 and an electric field of 1000 V/cm was applied across the separation channel. When the negatively charged fluorescein sample was injected, the sample plug migrated downstream to the anode immediately because the electrophoresis of analyte and EOF were in the same direction. The injected sample volume shown in Figure 3 is estimated as ~270 pL based on the plug shape and the microchannel dimensions.
Figure 3.
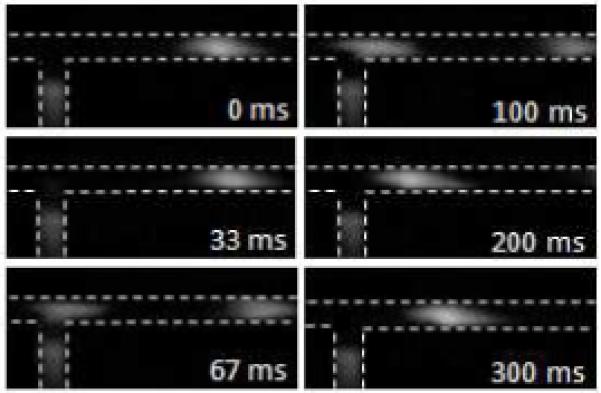
Micrograph sequences depicting a cycle of sample injection controlled by a pneumatic valve. The microchannel width was 100 μm. The valve was integrated at the interface with an area of 100 × 100 μm2. The tested sample was fluorescein solution.
The sample injection can be operated at different frequencies in the present injection mode. Figure 4 shows four repeatable injection results at frequencies of 0.21 Hz, 0.43 Hz, 1.1 Hz, and 2.2 Hz, respectively. The fluorescence intensity was recorded close to the T intersection. The relative standard deviations (RSD) of the peak height and width shown in Figure 4 are listed in Table 1, which indicates good reproducibility has been achieved for repeated injections with RSD less than 3.6%. In all the tests, the valve actuation time was the same (33 ms). In Figure 4A, broader peaks were obtained as the valve control and sample injection pressures were set as 20 psi and 2 psi, respectively, and the injected sample volume was approximately 500 pL. In Figures 4B and 4C, the valve control and sample injection pressures were 30 psi and 1 psi, respectively. In Figure 4D, the valve control and sample injection pressures were respectively set at 30 psi and 1.5 psi.
Figure 4.


Fluorescence intensity of the multiple injected fluorescein samples at different frequencies indicated in each figure. Other operation conditions were described in section 3.2.
Table 1.
Relative standard deviation (RSD) of the peak height and width shown in Figure 4.
| A | B | C | D | |
|---|---|---|---|---|
| RSD of peak height | 1.8% | 2.9% | 3.4% | 1.8% |
| RSD of peak width | 3.4% | 3.6% | 3.3% | 3.6% |
3.3 Characterization of hydrodynamic injection
The injected sample volume depends on several factors, including the valve open time, sample injection pressure, and the flow resistance at the interface. The valve open time is determined by the valve actuation time, the valve control gas pressure, and the mechanical properties of the PDMS membrane. Figure 5 depicts the relationships between those parameters and the peak width of injected fluorescein samples. Here, the peak width was recorded at approximately 400 μm downstream of the intersection to represent the original injected sample plug size and minimize the influence of the plug migration in the channel and diffusion. All data shown here were collected from the same device.
Figure 5.


Characterization of hydrodynamic injection controlled by a pneumatic valve. A) Injected sample peak width versus valve actuation time, B) peak width versus sample injection pressure, C) peak width versus valve control pressure, and D) peak width versus valve actuation frequency.
Figure 5A shows that the peak width increases linearly with the valve actuation time, as a longer valve actuation time allows more sample to enter into the separation channel. In this experiment, the sample injection pressure was 1 psi and the valve control gas pressure was 30 psi. The valve actuation frequency was 0.21 Hz. Valve actuation times ranging from 33 ms to 167 ms were investigated. The insets are the pictures of the injected fluorescein sample plugs corresponding to different valve actuation times. Based on the length of the sample plugs and the dimension of the channel, the injected sample volumes were estimated to be less than 200 pL to approximately 1 nL. Longer actuation times (> 200 ms) were not tested because the injected sample plug would be too long to achieve good CE separation performance. Similarly, the peak width increases linearly with the sample injection pressure as expected (Figure 5B). Here, the valve actuation time (33 ms) and frequency (0.21 Hz) were held constant, and the valve control gas pressure was 30 psi. Only low injection pressures (1-3 psi) were investigated, as higher injection pressure would induce pulsed hydrodynamic flow in the separation channel and adversely affect the separation. Figure 5C shows that the peak width linearly decreases with increase in the valve control gas pressure. During this investigation, the valve actuation time (33 ms) and frequency (0.21 Hz) and the sample injection pressure (1.5 psi) were kept constant. Valve control gas pressure was tested from 20 psi to 40 psi. When the pressure was lower, the response of the PDMS membrane to the pressure was slow and, therefore, it took longer time to close the valve. This resulted in a longer valve open time at lower valve control pressure. If the pressure was too low (<20 psi), sample leakage could happen because the valve was not completely closed when actuated, or the injected sample plug was too long. At higher control pressure, the PDMS membrane would stick on the channel surface and take longer time to relax back to open the valve while the PDMS membrane would respond to the higher control pressure to close the valve faster. Thus, the actual valve open time was shorter at a given injection frequency which resulted in a smaller injected sample plug or the narrower peak width at higher control pressure as shown in Figure 5C. If the pressure was too high (> 40 psi), the PDMS membrane would stick on the channel surface tightly. It would take very long time to open the valve, such that the valve may not opened at all during actuation. By properly adjusting the valve control pressure to an intermediate value (e.g., 30 psi), the valve actuation time and the actual valve open time were essentially the same.
Figure 5D shows that the injected sample plug size is independent of the valve actuation frequency. In these series of tests, the sample injection pressure was 1 psi, the valve actuation time was 33 ms, and the valve control pressure was 30 psi. As such, the valve open time and sample injection driving force were constant during the experiments. Because both the sample and run buffer were dilute aqueous solutions, the flow resistance at the interface was negligible. Therefore, the injected sample plug size was constant at different valve actuation frequencies.
3.4 Microchip CE separations
Figure 6 shows a CE separation of four FITC-labeled amino acids using the pneumatic valve-controlled hydrodynamic injection method. The sample concentration of each amino acid was 250 nM. The valve actuation time and frequency were set as 67 ms and ~0.1 Hz, respectively. The sample injection and valve control gas pressures were 3 psi and 40 psi, respectively. When the valve was actuated, the data acquisition system was activated to record the fluorescence intensity at the end of the separation channel. The analyte migration distance was measured as approximately 2.4 cm. Only the first cycle of separation was shown in Figure 6. Four major peaks were completely resolved in 15 s, and some minor peaks were also detected that arose from impurities present in the sample, such as free FITC. The theoretical plate numbers of each major peak are calculated and listed in Table 2. The efficiency of the separation is higher than 9.2 × 10³ plates for ~2.4 cm long microchannel, corresponding to 3.8 × 10⁵ plates/m, which is consistent with the previously reported CE separations using PDMS microchips [38].
Figure 6.

Microchip electrophoresis of four FITC-labeled amino acids. Peak identifications: (1) Asp, (2) Gly, (3) Phe, and (4) Arg. Applied electric field: 1kV/cm; valve control pressure: 40 psi; sample injection pressure: 3 psi; valve actuation time: 67 ms; valve actuation frequency: ~0.1 Hz.
Table 2.
Figure 7 shows a repeated CE separation of three FITC-labeled amino acids. The 90 s period of separation shown here was collected after running the microchip continuously for ~2 h, corresponding to more than 700 runs. The average separation efficiency for each peak is listed in Table 2. Compared with the separation shown in Figure 6, the efficiencies obtained in Figure 7 decreased slightly due to some degradation of the PolyE-323 dynamic coating during the preceding hours of operation. Still, the efficiency was higher than 2.9 × 10⁵ plates/m. It should be noted that the peak positions on the time scale were not the real peak migration times. The migration times of each peak can be estimated based on the intervals between injections and the first valve actuation time.
Figure 7.

Repeated microchip CE of three FITC-labeled amino acids. Peak identifications: (1) Gly, (2) Phe, and (3) Arg. The operation conditions were the same as those shown in Figure 6.
One advantage of hydrodynamic injection is the expected lack of an injection bias, which was investigated based on the separations of the same sample shown in Figure 7 at different time during continuous operation. Peak area ratios relative to the first peak displayed in each set of separation are listed in Table 3. For each peak, the values fluctuate slightly and indicate no significant sample bias in the hydrodynamic injection. In contrast, the values changed by a factor of two following 20 runs for an electrokinetic injection method reported previously [39]. While the presented separations here are not optimized, they compare favorably with other separations using PDMS substrates [38] and serve to prove the concept of bias-free pressure-driven injection with pneumatic valving.
Table 3.
Relative peak areas from the repeated separation of three amino acids.
| peak area ratio | Figure 7 | Runs 1-4 | Runs 37-40 | Runs 97-100 |
|---|---|---|---|---|
| S2/S1 | 44 ± 3% | 41 ± 3% | 47 ± 2% | 45 ± 3% |
| S3/S1 | 34 ± 3% | 32 ± 1% | 33 ± 2% | 36 ± 2% |
S1, S2 and S3 represent the peak areas of 1st, 2nd and 3rd peak, respectively, indicated in Figure 7.
4 Concluding remarks
A single pneumatic valve based on the thin PDMS membrane has been successfully integrated to control the sample injection for microchip CE separation. The system has a simple design, which contains a single T intersection on the flow layer and a single valve on the control layer. The valve is aligned at the T-shaped intersection to confine the sample solution. When the valve is actuated, the sample solution with subnanoliter volume immediately flows into the separation channel for subsequent CE separation. The injected sample volume is determined by the low injection pressure and the valve operation conditions. Additionally, the valve can be operated at different frequencies for an extended period of time to perform multiple CE separations. The hydrodynamic injection system has a couple of advantages compared with traditional injection methods, including reproducible, controllable and unbiased sample injection. The simple operation involves fewer electrodes and power supplies and no voltage switching. Other attractive features of this system include essentially no sample waste and a high duty cycle. Repeated CE separations for improved detection limits can be carried out conveniently based on this injection method.
Acknowledgements
We thank Dr. Rafael Gómez-Sjöberg from the Stanford Microfluidics Foundry for generously providing us with the circuit board to construct the valve controller. Portions of this research were supported by the U.S. Department of Energy (DOE) Office of Biological and Environmental Research, the NIH National Center for Research Resources (RR018522). This research was performed in the Environmental Molecular Sciences Laboratory (EMSL), a U.S. DOE national scientific user facility located at the Pacific Northwest National Laboratory (PNNL) in Richland, WA. PNNL is a multiprogram national laboratory operated by Battelle for the DOE under Contract No. DE-AC05-76RLO 1830.
Abbreviations
- Arg
arginine
- Asp
Aspartic acid
- Gly
glycine
- HMDS
hexamethyldisilazane
- HPC
hydroxypropyl cellulose
- Phe
phenylalanine
Footnotes
The authors have declared no conflict of interest.
5 References
- [1].Reyes DR, Iossifidis D, Aurous P-A, Manz A. Anal. Chem. 2002;74:2623–2636. doi: 10.1021/ac0202435. [DOI] [PubMed] [Google Scholar]
- [2].Aurous P-A, Iossifidis D, Reyes DR, Manz A. Anal. Chem. 2002;74:2637–2652. doi: 10.1021/ac020239t. [DOI] [PubMed] [Google Scholar]
- [3].Effenhauser CS, Manz A, Widmer HM. Anal. Chem. 1993;65:2637–2642. [Google Scholar]
- [4].Harrison DJ, Fluri K, Seiler K, Fan Z, Effenhauser CS, Manz A. Science. 1993;261:895–897. doi: 10.1126/science.261.5123.895. [DOI] [PubMed] [Google Scholar]
- [5].Woolley AT, Mathies RA. Proc. Natl. Acad. Sci. USA. 1994;91:11348–11352. doi: 10.1073/pnas.91.24.11348. [DOI] [PMC free article] [PubMed] [Google Scholar]
- [6].Duffy DC, McDonald JC, Schueller OJA, Whitesides GM. Anal. Chem. 1998;70:4974–4984. doi: 10.1021/ac980656z. [DOI] [PubMed] [Google Scholar]
- [7].Kelly RT, Pan T, Woolley AT. Anal. Chem. 2005;77:3536–3541. doi: 10.1021/ac0501083. [DOI] [PubMed] [Google Scholar]
- [8].Shadpour H, Soper SA. Anal. Chem. 2006;78:3519–3527. doi: 10.1021/ac0600398. [DOI] [PubMed] [Google Scholar]
- [9].Sun X, Li D, Lee ML. Anal. Chem. 2009;81:6278–6284. doi: 10.1021/ac9001832. [DOI] [PubMed] [Google Scholar]
- [10].Jacobson SC, Hergenröder R, Koutny LB, Warmack RJ, Ramsey JM. Anal. Chem. 1994;66:1107–1113. [Google Scholar]
- [11].Jacobson SC, Koutny LB, Hergenröder R, Moore J, A. W, Ramsey JM. Anal. Chem. 1994;66:3472–3476. [Google Scholar]
- [12].Jacobson SC, Ermakov SV, Ramsey JM. Anal. Chem. 1999;71:3273–3276. doi: 10.1021/ac990059s. [DOI] [PubMed] [Google Scholar]
- [13].Backofen U, Matysik F-M, Lunte CE. Anal. Chem. 2002;74:4054–4059. doi: 10.1021/ac020110j. [DOI] [PMC free article] [PubMed] [Google Scholar]
- [14].Luo YW, D., Zeng S, Gai H, Long Z, Shen Z, Dai Z, Qin J, Lin B. Anal. Chem. 2006;78:6074–6080. doi: 10.1021/ac0605142. [DOI] [PubMed] [Google Scholar]
- [15].Gai H, Yu L, Dai Z, Ma Y, Lin B. Electrophoresis. 2004;25:1888–1894. doi: 10.1002/elps.200305835. [DOI] [PubMed] [Google Scholar]
- [16].Gong M, Wehmeyer KR, Stalcup AM, Limbach PA, Heineman WR. Electrophoresis. 2007;28:1564–1571. doi: 10.1002/elps.200600616. [DOI] [PMC free article] [PubMed] [Google Scholar]
- [17].Solignac D, Gijs MAM. Anal. Chem. 2003;75:1652–1657. doi: 10.1021/ac026350g. [DOI] [PubMed] [Google Scholar]
- [18].Lacharme F, Gijs MAM. Electrophoresis. 2006;27:2924–2932. doi: 10.1002/elps.200500723. [DOI] [PubMed] [Google Scholar]
- [19].Fütterer C, Minc N, Bormuth V, Codarbox J-H, Laval P, Rossier J, Viovy J-L. Lab Chip. 2004;4:351–356. doi: 10.1039/b316729a. [DOI] [PubMed] [Google Scholar]
- [20].Zhang L, Yin X, Fang Z. Lab Chip. 2006;6:258–264. doi: 10.1039/b511924c. [DOI] [PubMed] [Google Scholar]
- [21].Qi L-Y, Yin X-F, Zhang L, Wang M. Lab Chip. 2008;8:1137–1144. doi: 10.1039/b800085a. [DOI] [PubMed] [Google Scholar]
- [22].Lin C-C, Chen C-C, Lin C-E, Chen S-H. J. Chromatogr. A. 2004;1051:69–74. [PubMed] [Google Scholar]
- [23].Cho SI, Lee S-H, Chung DS, Kim Y-K. J. Chromatogr. A. 2005;1063:253–256. doi: 10.1016/j.chroma.2004.11.088. [DOI] [PubMed] [Google Scholar]
- [24].Price AK, Anderson KM, Culbertson CT. Lab Chip. 2009;9:2076–2084. doi: 10.1039/b823465e. [DOI] [PubMed] [Google Scholar]
- [25].Price AK, Culbertson CT. Anal. Chem. 2009;81:8942–8948. doi: 10.1021/ac9015837. [DOI] [PubMed] [Google Scholar]
- [26].Li MW, Huynh BH, Hulvey MK, Lunte SM, Martin RS. Anal. Chem. 2006;78:1042–1051. doi: 10.1021/ac051592c. [DOI] [PubMed] [Google Scholar]
- [27].Bowen AL, Martin RS. Electrophoresis. 2010;31:2534–2540. doi: 10.1002/elps.201000029. [DOI] [PMC free article] [PubMed] [Google Scholar]
- [28].Unger MA, Chou H-P, Thorsen T, Scherer A, Quake SR. Science. 2000;288:113–116. doi: 10.1126/science.288.5463.113. [DOI] [PubMed] [Google Scholar]
- [29].Melin J, Quake SR. Annu. Rev. Biophys. Biomol. Struct. 2007;36:213–231. doi: 10.1146/annurev.biophys.36.040306.132646. [DOI] [PubMed] [Google Scholar]
- [30].Hardenborg E, Zuberovic A, Ullsten S, Söderberg L, Heldin E, Markides KE. J. Chromatogr. A. 2003;1003:217–221. doi: 10.1016/s0021-9673(03)00739-8. [DOI] [PubMed] [Google Scholar]
- [31].Bergström SK, Edenwall N, Lavén M, Velikyan I, Långström B, Markides KE. Anal. Chem. 2005;77:938–942. doi: 10.1021/ac0492618. [DOI] [PubMed] [Google Scholar]
- [32].Dahlin AP, Wetterhall M, Liljegren G, Bergström SK, Andrén P, Nyholm L, Markides KE, Bergquist J. Analyst. 2005;130:193–199. doi: 10.1039/b414592e. [DOI] [PubMed] [Google Scholar]
- [33].Mellors JS, Gorbounov V, Ramsey RS, Ramsey JM. Anal. Chem. 2008;80:6881–6887. doi: 10.1021/ac800428w. [DOI] [PMC free article] [PubMed] [Google Scholar]
- [34].Ullsten S, Zuberovic A, Wetterhall M, Hardenborg E, Markides KE, Bergquist J. Electrophoresis. 2004;25:2090–2099. doi: 10.1002/elps.200305787. [DOI] [PubMed] [Google Scholar]
- [35].Thorsen T, Maerkl SJ, Quake SR. Science. 2002;298:580–584. doi: 10.1126/science.1076996. [DOI] [PubMed] [Google Scholar]
- [36].Kelly RT, Tang K, Irimia D, Toner M, Smith RD. Anal. Chem. 2008;80:3824–3831. doi: 10.1021/ac8000786. [DOI] [PMC free article] [PubMed] [Google Scholar]
- [37].Hata K, Kichise Y, Kaneta T, Imasaka T. Anal. Chem. 2003;75:1765–1768. doi: 10.1021/ac026330e. [DOI] [PubMed] [Google Scholar]
- [38].Vickers JA, Caulum MM, Henry CS. Anal. Chem. 2006;78:7446–7452. doi: 10.1021/ac0609632. [DOI] [PubMed] [Google Scholar]
- [39].Karlinsey JM, Monahan J, Marchiarullo DJ, Ferrance JP, Landers JP. Anal. Chem. 2005;77:3637–3643. doi: 10.1021/ac048115z. [DOI] [PubMed] [Google Scholar]