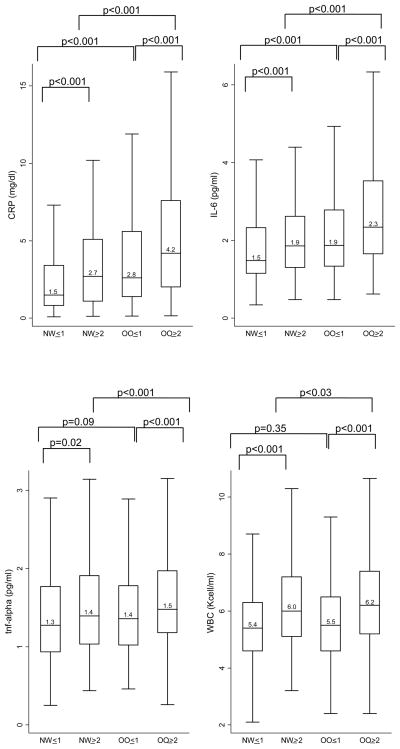
Figure 1.
Median Acute-Phase Marker Levels by Body Size Phenotypes
Horizontal lines represent medians, while bottom and top of boxes represent 25th and 75th percentiles, respectively. NW=Normal weight; OO=overweight/obese; ≤1 = 0 or 1 cardiometabolic abnormalities and no diabetes; ≥2= 2 or more cardiometabolic abnormalities or diabetes
Cardiometabolic abnormalities considered were: 1.) systolic/diastolic blood pressure ≥130/85 mmHg or antihypertensive medication use, 2.) fasting triglycerides ≥1.7 mmol/L, 3.) HDL <1.3 mmol/L and 4.) fasting glucose ≥7.0 mmol/L or antidiabetic med use

