
Figure 5. Phosphorylation of AMPK.
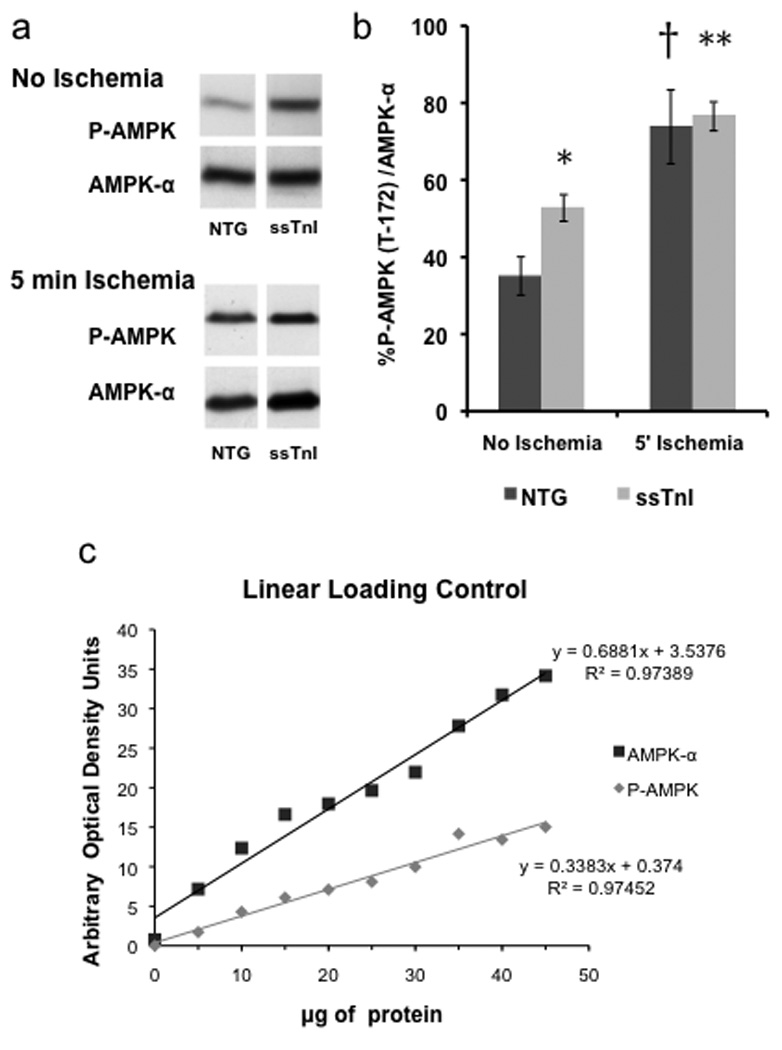
a) Western blots of phosphorylated AMPK (P-AMPK) and total AMPK from hearts at baseline (no ischemia) and during ischemia are shown. b) Bar graph displays percentages of phosphorylated AMPK in non-transgenic (NTG) and ssTnI expressing hearts (TG-ssTnI) harvested under baseline conditions and after 5 minutes of ischemia (mean ± SE). Dark bar, nontransgenic (NTG); Gray bar, TG-ssTnI (ssTnI). *, P< 0.05 versus NTG. †, P<0.05 versus NTG No Ischemia. **, P<0.01 versus ssTnI No Ischemia. c) Linear loading control for both AMPK-α and P-AMPK. All samples were loaded within this linear range (20–40 µg of ventricular proteins).