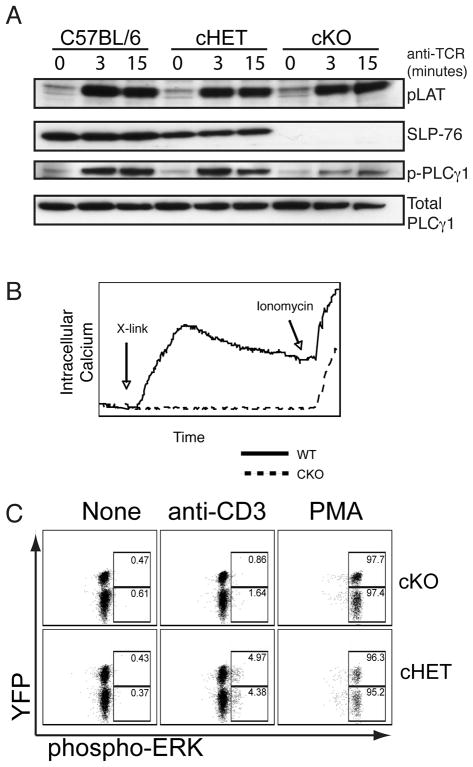
Figure 2. SLP-76CKO T cells are unable to transduce TCR-mediated signals.
(A) FACS-sorted CD90.2+YFP+ T cells were left unstimulated or stimulated with anti-CD3 (500A2) for the time periods indicated followed by lysis and western blotting to detect SLP-76, pLAT and pPLCγ1. Total PLCγ1 is shown as a loading control. Representative of three individual experiments. (B) Cell suspensions from lymph node of indicated mice loaded with Indo1 were stimulated by co-crosslinking cell surface CD3 and CD4 (indicated by arrow). Intracellular calcium was measured as a ratio of FL4/FL5. Ionomycin was added to each sample during the last 30 seconds of acquisition. Representative of two experiments (C) Splenocytes stimulated for 15 minutes with 500A2 or PMA were assessed for phopsphorylation of ERK. Dot plots are gated on CD4+ cells. Numbers within the gated areas are relative percentages of YFP+ and YFP− gated cells that stain positive for pERK. Representative of cells from 6 SLP-76cHET and 4 SLP-76cKO mice.

