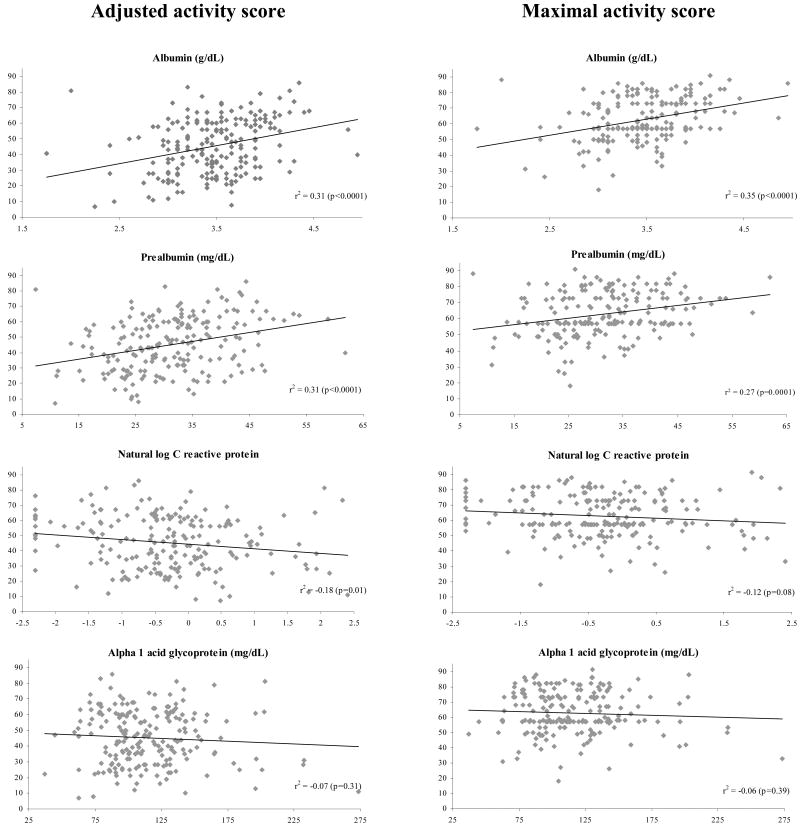
Figure 2. Correlation of AAS and MAS with laboratory markers.
Activity scores can range from 0-94. Pearson r2 and corresponding p values are displayed. Significant correlation was seen between AAS and albumin, prealbumin and CRP; and between MAS and albumin and prealbumin. Abbreviations: AAS-Adjusted activity score; MAS-Maximal activity score; CRP-C-reactive protein.

