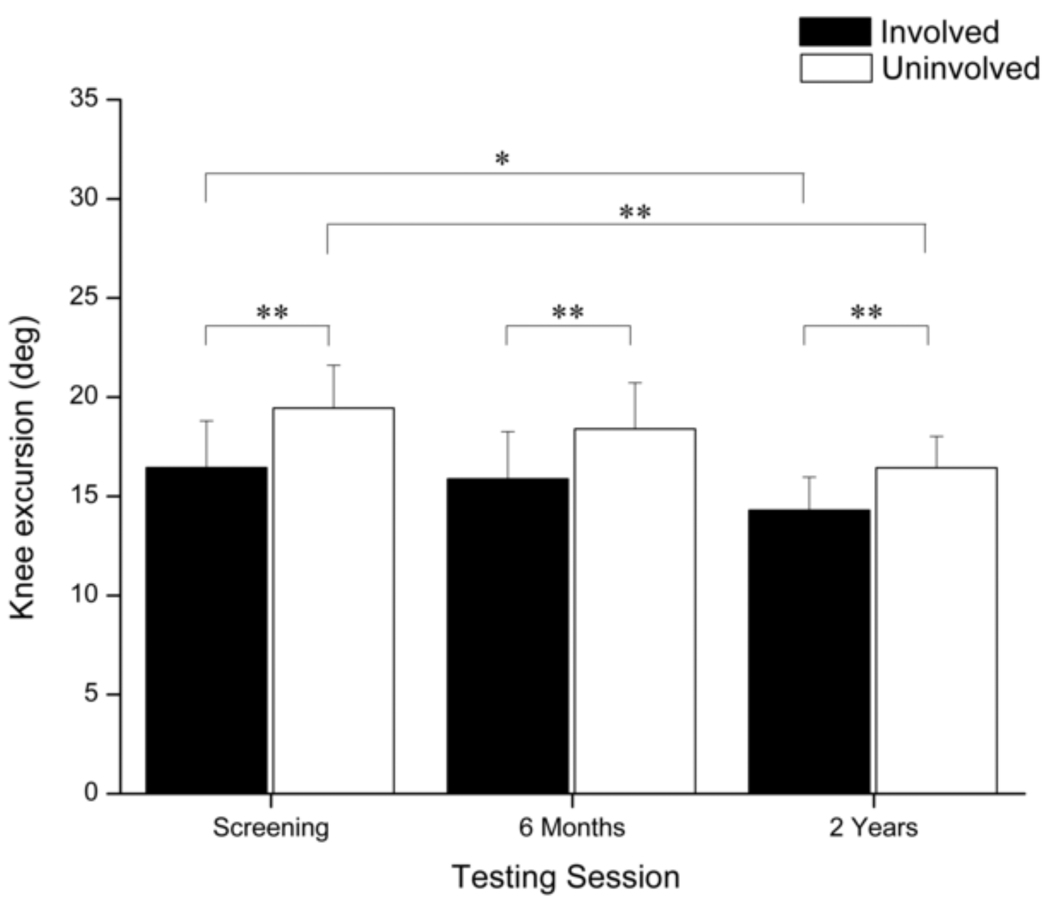
Fig. 3.
Comparison of knee excursions during weight acceptance between limbs and across testing sessions. Error bars represent 95% confidence intervals. Knee excursions decreased in both limbs over time; however, excursions were significantly smaller in the involved limb during each testing session. (* p < 0.05)(** p < 0.001).

