Figure 6.
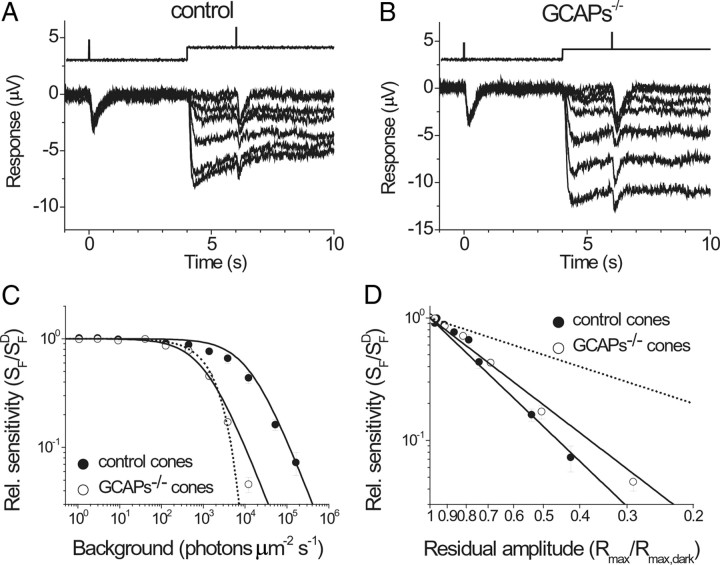
Effect of background light on cone sensitivity in control and GCAPs−/− retinas. Sensitivity under a series of background lights was measured from dim flash responses delivered 2 s after the onset of step light illumination in control (A) and GCAPs−/− (B) retinas. The time course of light stimulation is shown on the top of each panel. The flash intensities (photons μm−2) delivered in darkness for control and GCAPs−/− retinas were 1.6 × 10³ and 120, respectively. The flash intensities (photons μm−2) delivered on the step light for control retina were 1.6 × 10³ for the first five traces, 4.5 × 10³, and 1.5 × 10⁴. The flash intensities (photons μm−2) delivered on the step light for GCAPs−/− retina were 120 for first five traces, 500, and 1.6 × 10³. The step light intensities in A and B are the same as in Figure 5, A and B, respectively. C, Fractional sensitivity (SF/SFD) as a function of background intensity. Flash sensitivity (SF) was determined by dividing the peak amplitude of dim flash response by the flash intensity and the maximal response amplitude for each retina. SFD is the flash sensitivity in darkness. Averages of control (filled circles) and GCAPs−/− (open circles) retinas. Solid curves are best-fitting Weber–Fechner functions with Is = 12,900 (control) and 1100 (GCAPs−/−) photons μm−2 s−1. The dotted curve represents the expected change in sensitivity of GCAPs−/− cones in the absence of adaptation (Eq. 4). D, Relative sensitivity (SF/SFD) as a function of the residual amplitude (Rmax/Rmax,dark) for control and GCAPs−/− cones. Combined data from C and Figure 5C. Residual amplitude determines the internal calcium concentration; as the residual amplitude declines, the internal calcium concentration becomes low. The decline in sensitivity against the reduction of calcium concentration was substantially shallower in GCAPs−/− retinas than in control retinas, demonstrating the impaired cone adaptation in the absence of GCAPs. The parameters of the best-fitting power functions (solid lines) are 2.94 for control cones and 2.35 for GCAPs−/− cones. The dotted line represents the expected change in sensitivity in the absence of Ca2+ modulation (Eq. 4) in GCAPs−/− cones. Error bars show SEM.

