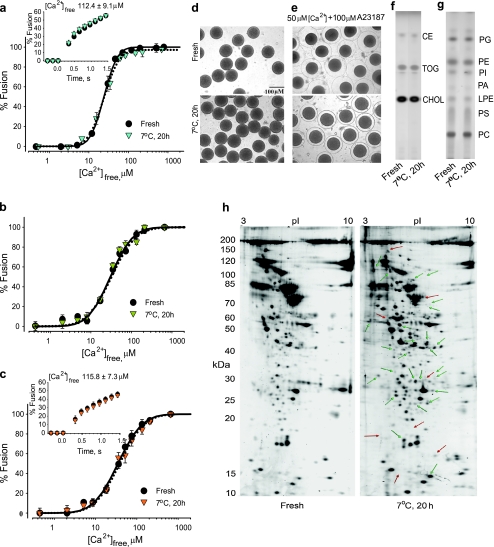
Fig. 2.
Comparison of fresh and 20-h incubated preparations. a Ca2+–activity curves for CV–CV fusion, including kinetics (inset) (n = 5) (for CV isolated from fresh and incubated eggs). b Ca2+–activity curves for ‘settle’ CV–CV fusion (n = 5). c Ca2+–activity curves for CSC fusion, including kinetics (inset) (n = 4–5). d Fresh and incubated (7 °C) sea urchin eggs. e Fresh and incubated eggs after treatment with 50 μM Ca2+ and 100 μM A23187. Detection of f neutral and g phospholipids and lysolipids (representative of four separate experiments). Locations of lipid names correspond to co-resolved standards. CHOL cholesterol, TOG trioleoylglycerol, CE cholesterol esters, PC phosphatidylcholine, LPA lysophosphatidic acid, PS phosphatidylserine, LPE lysophosphatidylethanolamine, PA phosphatidic acid, PI phosphatidylinositol, PE phosphatidylethanolamine, PG phosphatidylglycerol. h 2D gel maps of CV membrane proteins isolated from fresh and incubated eggs. Protein relative abundance differences of >5-fold are indicated: average gel images are from three independent 2D gel separations; green and red arrows represent, respectively, increases and decreases in protein amounts

