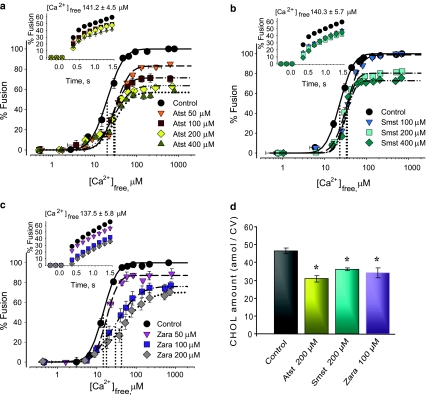
Fig. 3.
CHOL-lowering agents inhibit CV–CV fusion. Ca2+–activity curves of CV isolated from eggs incubated with a Atst (n = 4–7), b Smst (n = 5–7), and c Zara (n = 3–4), including kinetics (inset). Vertical dotted lines indicate EC50 of each curve. d Quantification of CV membrane CHOL following incubations (n = 4); *P < 0.01 indicates significant difference from control

