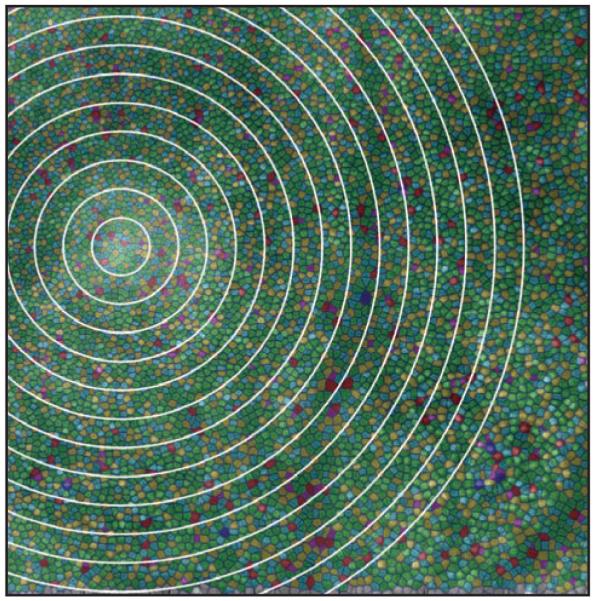
Figure 3.

Analysis of mosaic regularity analysis. Shown are the Voronoi boundaries associated with each cone identified using the automated program of Li and Roorda.15 Green color indicates Voronoi domains with 6 sides, reflecting hexagonal/triangular packing of the cone mosaic. Other colors indicate domains with greater or fewer than 6 sides and qualitative disruption can be seen overlying the larger vertical blood vessel where the cone mosaic was not completely resolved. White circles represent the boundaries of the 50-μm wide annular rings used to compare the regularity of the mosaic directly over the drusen with that elsewhere in the image.
